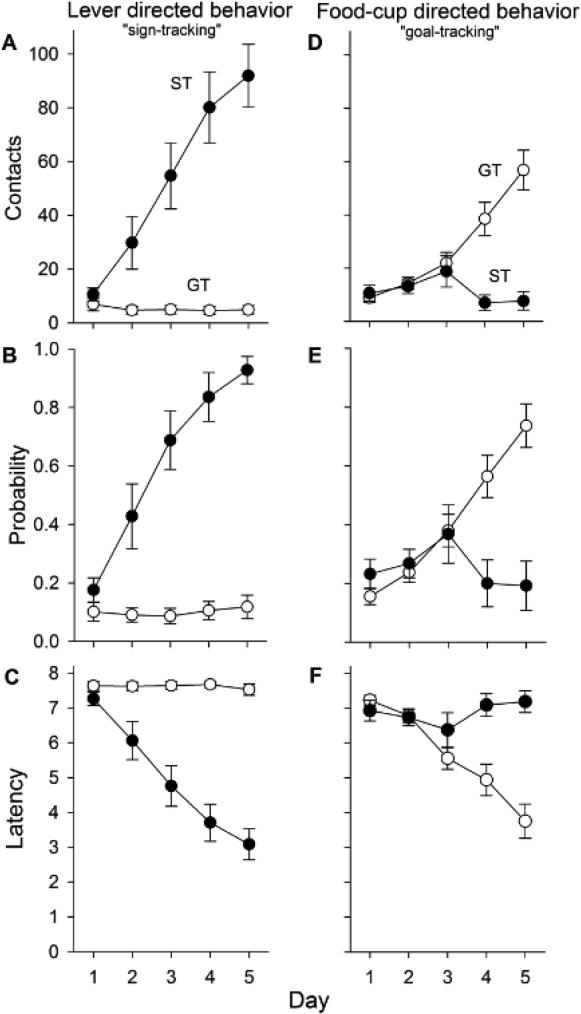
Fig. 1.
Sign-tracking (left) and goal-tracking (right) behaviors during Pavlovian Conditioned Approach. Contacts indicate the mean number of lever contacts (A) and food cup entries (D) each day. Probability displays the mean number of trials in which a lever contact (B) or food cup entry (E) occurred. Latencies indicate the mean elapsed time (s) before either contacting the lever (C) or entering the food cup (F). Data are represented as the mean (+/− SEM). Rats were categorized as STs (n = 10) or GTs (n = 18) based on calculated PavCA index (see “Methods and Materials”). See text for the description of statistical results.

