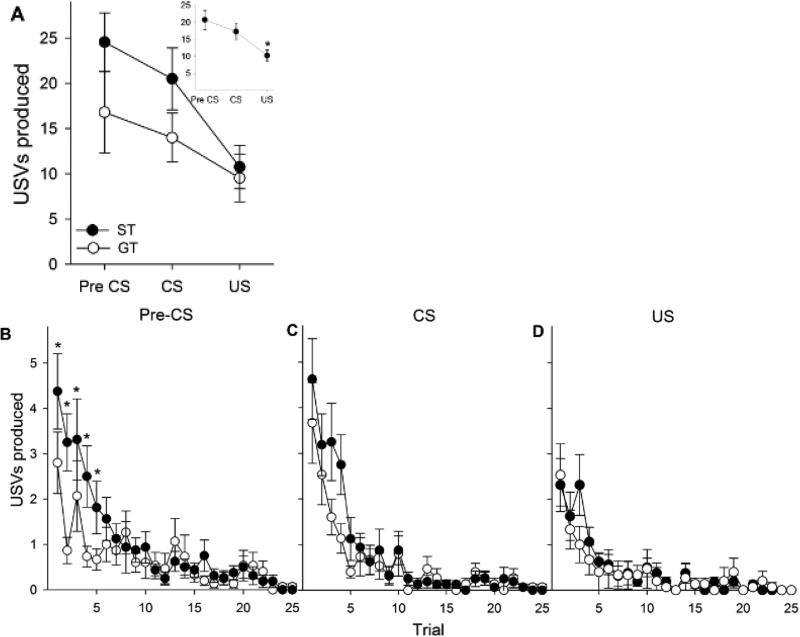
Fig. 4.
USVs produced by STs (n = 16) and GTs (n = 15) during each eight-second period summed over the 25 trials of PavCA in experiment 2 (A). Inset depicts mean USVs during each period collapsed across phenotype (n=31). Asterisk (*) indicates a significant decrease (p < 0.05) of in USVs produced during the US period compared to pre-CS and CS periods. Pre-CS (B), CS (C) and US (D) panels show USVs produced by STs and GTs during the 25 trials of PavCA. Asterisks (*) indicates a significant ST/GT difference for designated trials. Data are represented as the mean (+/− SEM).

