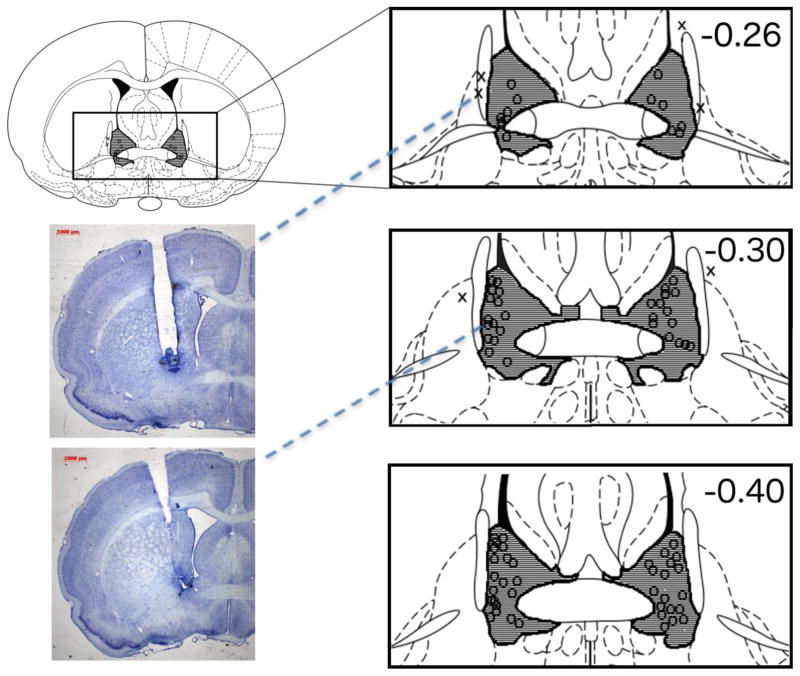
Figure 1.
Histological confirmation of cannula placements within the BNST. Shaded areas indicate regions where successful cannula placements were identified. Locations marked with an “O” indicate the placement of cannula tips within the targeted region. The “X’s” indicate placements that missed the target and were separately analyzed as anatomical controls. Not pictured are 6 animals whose cannulae tips were located within the lateral ventricles and 4 animals whose cannulae placements were posterior to the target region. Numbers represent distance of coronal slices (in mm) posterior to bregma. Figure adapted from Paxinos and Watson (2005). The two representative photomicrographs provide an example of a missed cannula placement (top) and a correctly placed cannula (bottom) sitting above the BNST. Dashed lines point to the corresponding cannula placement on the schematic diagram. The darkly-stained areas at the tip of each cannula track reflect the tissue displaced by the cannula insertion. Note that the small diameter internal infusion cannula protruded beyond these tracks infusing drug into a spherical region beginning approximately 1 mm below the end of the cannula track. Both animals in these examples were infused with the 5-HT1B agonist; the subject with the missed cannula (top) made 18 retreats over the final 8 trials while the animal whose cannula was identified as ‘on target’ (bottom) for the BNST made 2 retreats during the final 8 trials. These individual data are reflective of the performance of the groups to which each animal was assigned.

