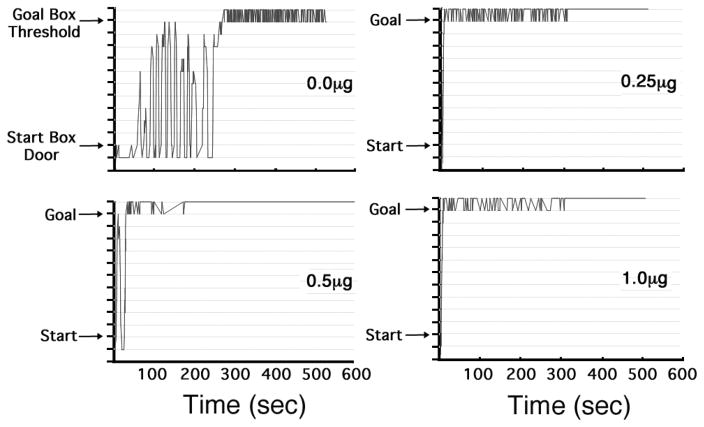
Figure 3.
Sample Spatio-Temporal Records from four representative animals -- one from each group as identified by the dose of the 5-HT1B agonist (CP 94,253) that was applied to each subject. The figure depicts the animal’s location within the alley in real time; i.e., the path that the animal took from start box (at the bottom the y-axis) to the goal box (near the top of the y-axis). Crossing the threshold into the goal box closed the goal-door behind the animal (to prevent retracing) and trigged infusion of 1.0mg/kg i.v. cocaine. Each panel depicts the behavior of a representative animal on Trial 15. Peaks in the graph correspond to retreats, i.e., a reversal in direction from approach to avoidance of the goal box.

