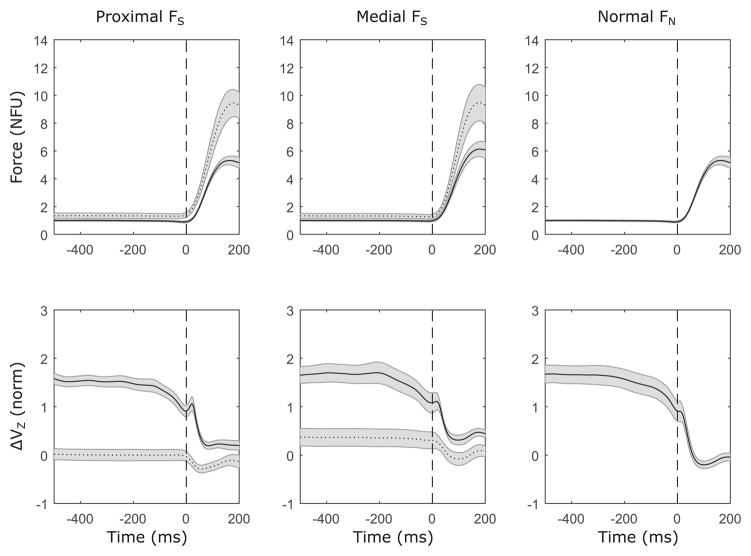
Figure 2.
Time profiles of across-subject averages of forces (top row) and z-transformed synergy index ΔVZ (bottom row) for three task variables: Proximal shear force (FS), medial FS, and normal force (FN). Solid lines represent the task variable, and dotted lines represent FN when FS is the task variable. Forces are normalized by steady state force production, which was 2.5% MVC for FS and 5% MVC for FN. Vertical dashed lines: force pulse onset. Averages across subjects with standard error shades are shown.

