Figure 4.
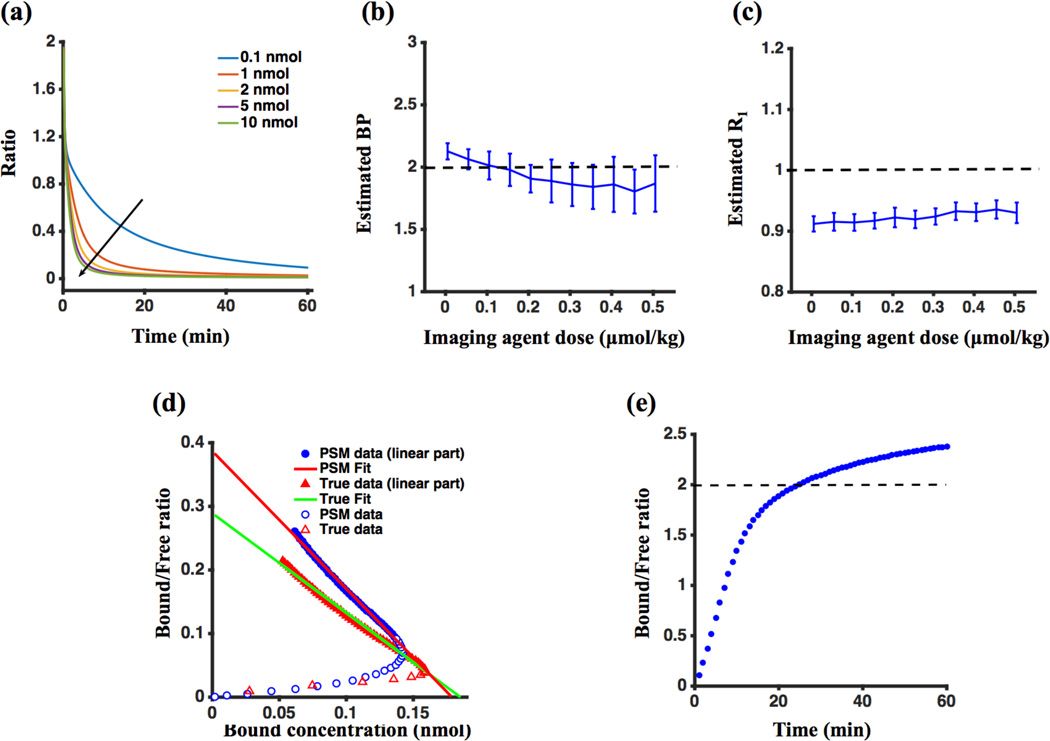
Simulation results. (a) Ratio of the rate of change of the bound concentration of targeted imaging agent (dCb,T(t)/dt) to the competing term in Eq. (7), which is a product of the rate constant of agent-receptor association, the available concentration of receptors and the free concentration of the targeted imaging agent (KonBavailCf,T(t)) for 60 min. (b) Estimated binding potential (BP) and (c) R1 (a parameter of fit accounting for differences in extravasation rate constants for the targeted and control imaging agents) for different injected imaging agent concentrations. (d) Noise-free dynamic Scatchard plots for both the partial-saturation model (PSM: (ROIT(t)-ROIC(t))/ROIC(t) vs. (ROIT(t)-ROIC(t)); solid blue data) and the “true” bound and free concentrations directly from the numerical simulations (True: Cb,T(t)/Cf,T(t) vs. Cb,T(t); solid red data). The blue and red open symbols are data points before 25 min (the time after which data became linear). The red line depicts the linear fit of the PSM data and the green line depicts the linear fit of the “true” data. (e) Noise-free “true” Cb,T(t)/Cf,T(t) vs. time for tracer dose conditions. The black dashed lines in (b), (c) and (e) indicate true values of BP, R1 and BP, respectively.

