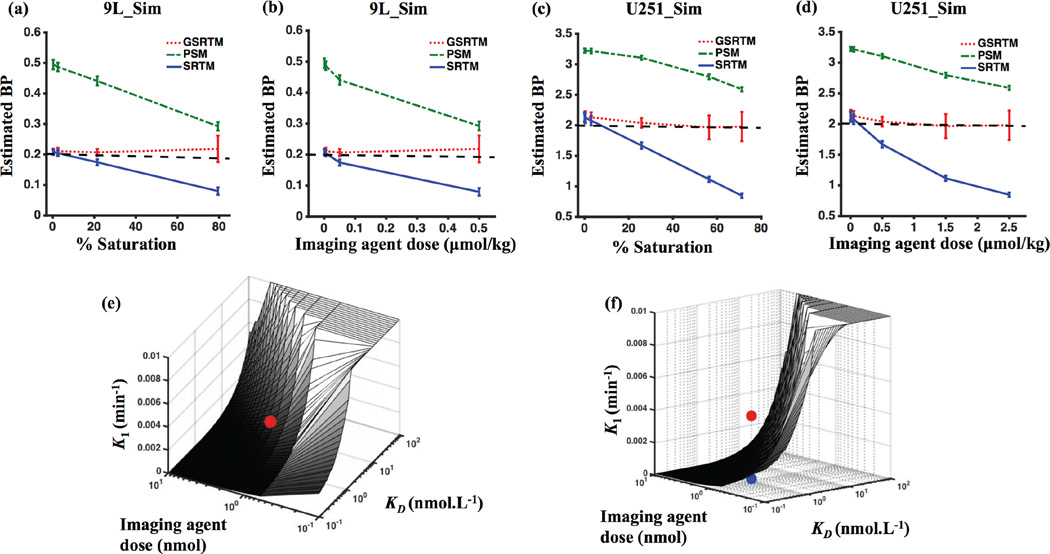
Figure 5.
Error in estimation of binding potential (BP) with GSRTM, SRTM and PSM: (a) Estimated BP for different % saturation for 9L_Sim. (b) Estimated BP for different injected imaging agent dose for 9L_Sim. (c) Estimated BP for different % saturation for U251_Sim. (d) Estimated BP for different injected imaging agent dose for U251_Sim. The green dot-dashed line is the PSM, the red dotted line is the GSRTM, the blue solid line is the SRTM and the black dashed line is the true BP value. (e) Map of K1 values that would result in a 20% saturation of receptors for a range of KD and initial injected drug dose values. (f) Another view of (e). Red and blue dots are showing the position of 9L-GFP and U251, respectively. For clarity, any application where the K1 is lower than the plane in (f) and (e) for a given dose and receptor concentration would be in the trace-level regime where SRTM would work, while any application with a K1 higher than the plane would be in the saturated regime where GSRTM would be required for an accurate estimate of binding potential.

