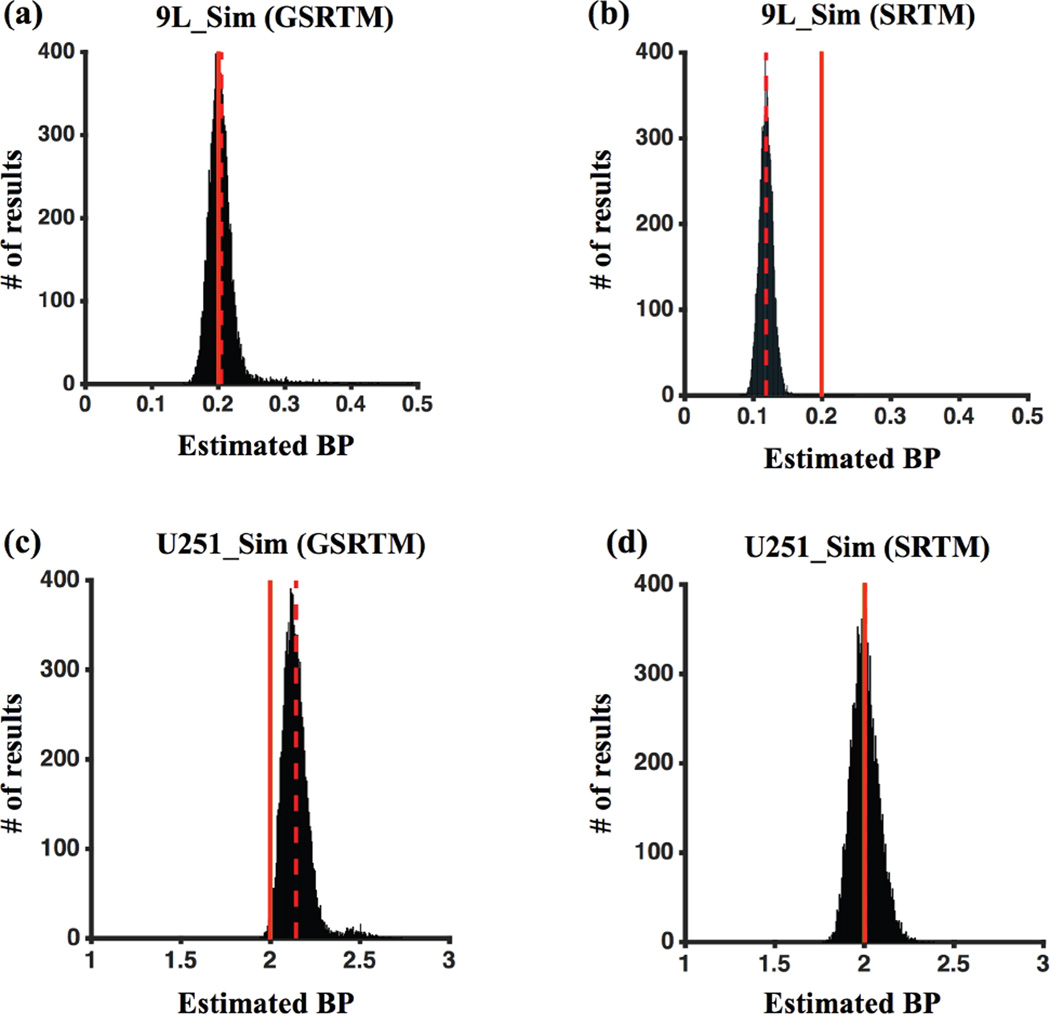
Figure 6.
Sensitivity of BP estimation in 9L_Sim data using GSRTM (a) and SRTM (b), and analysis of U251_Sim data analyzed with GSRTM (c) and SRTM (d). 3% of Gaussian noise added to each curve for 10,000 iterations. The red dashed and the red solid vertical lines indicate the positions of the means of the fit and the true BP, respectively.

