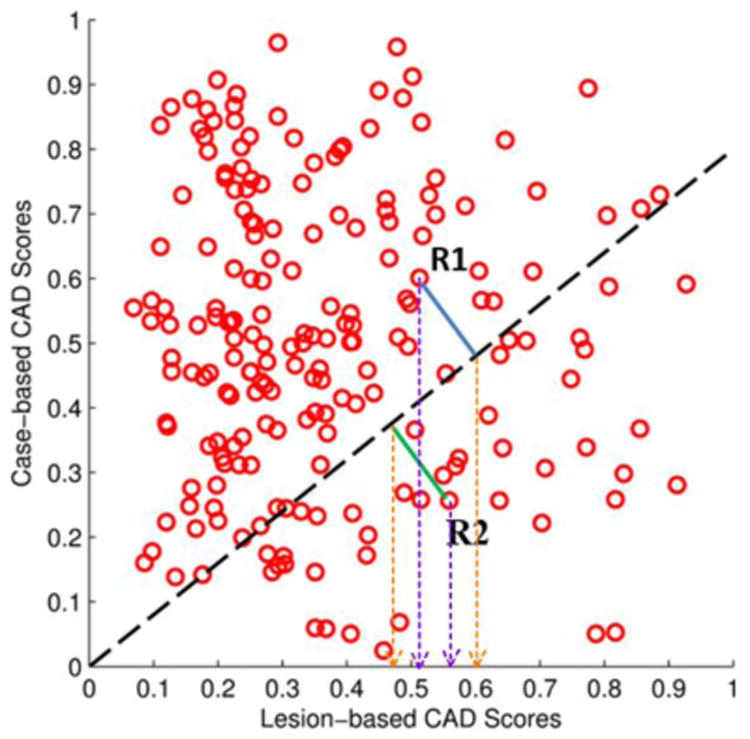
Figure 3.

An illustration of using the case based adaptive cueing method to adaptively change the CAD-generated lesion based detection scores by incorporating the case based CAD scores, and projecting the original lesion based scores unto a new scoring reference line depicted by the dashed black line in the figure. Two purple (inner) vertical dashed lines indicate the original lesion based CAD scheme generated detection scores, Sorg for two regions, R1 and R2, while two orange (outer) vertical dashed lines indicate the new detection scores after applying the adaptive cueing method on R1 and R2, respectively.
