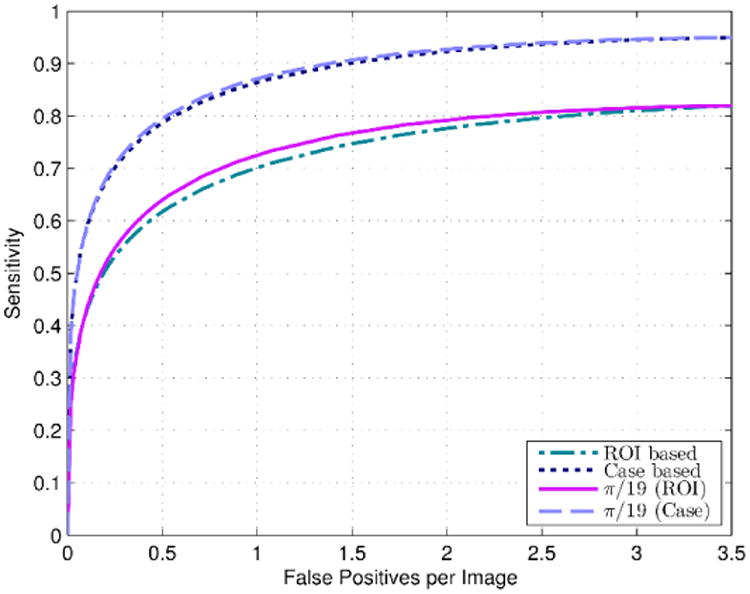
Figure 5.

ROI based and case based FROC curves obtained by applying our original lesion based CAD scheme in Ref. (Zheng et al., 2012a) to our evaluation dataset (924 cases), as well as the ROI and case based FROC curves obtained after applying the adaptive cueing method using the new case based CAD scheme scores at projection line angle, α = π / 19.
