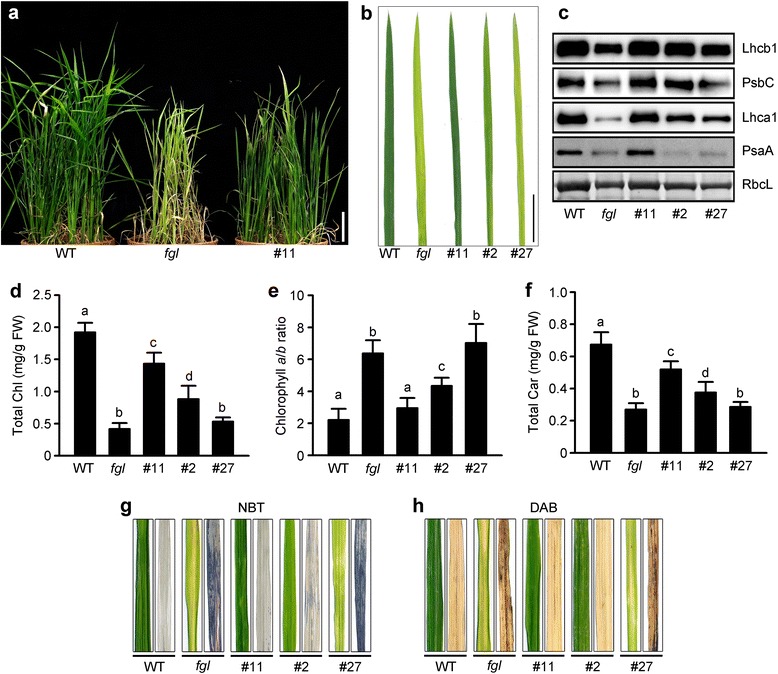
Fig. 4.

Characterization of OPAO plants under CL conditions. a-b Phenotypes of WT, fgl, and OPAO homozygous T2 plants. Shoots (a) and third leaf blades (b) grown under CL conditions in an artificial growth chamber (200 μmol m−2 s−1). Scale bar = 2 cm (b). c Immunoblot analysis of photosystem proteins. The proteins were detected using specific antibodies, but RbcL was visualized by Coomassie Blue staining (c). The detection was repeated three times with independent biological replicates (c). d-f Quantification of photosynthetic pigments in WT, fgl, and OPAO line #11. Total Chl contents (d), Chl a/b ratio (e), total Car contents (f). The data were obtained from 10 independent leaf samples, and means with different letter are significantly different (Duncan’s test, P < 0.01) (d-f). g-h Determination of ROS accumulation in leaves. Superoxide anion radicals (O2 −) (g) and hydrogen peroxide (H2O2) (h) in leaves. Superoxide anion radicals and hydrogen peroxide were visualized by staining with NBT (g) and DAB (h), respectively. Samples were obtained from 2-week-old plants grown in a growth chamber. All analyses were repeated at least twice and showed similar results
