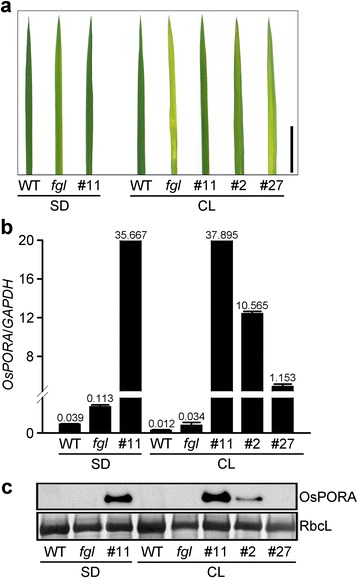
Fig. 5.

Expression patterns of OsPORA transcript and OsPORA protein in WT, fgl, and OPAO lines under SD and CL conditions. a Phenotypes of third leaf blades. Plants were grown for 2 weeks in artificial growth chambers (200 μmol m−2 s−1). Scale bar = 2 cm (a). b Transcript levels of OsPORA in WT, fgl, and OPAO plants. Numbers on the bars indicate relative values quantified by RT-qPCR. Means and standard deviations were obtained from three independent leaf blades (b). c Immunoblot assay of OsPORA protein. RbcL was visualized using CCB staining as a control (c). All analyses were repeated at least twice and produced similar results
