Figure 3.
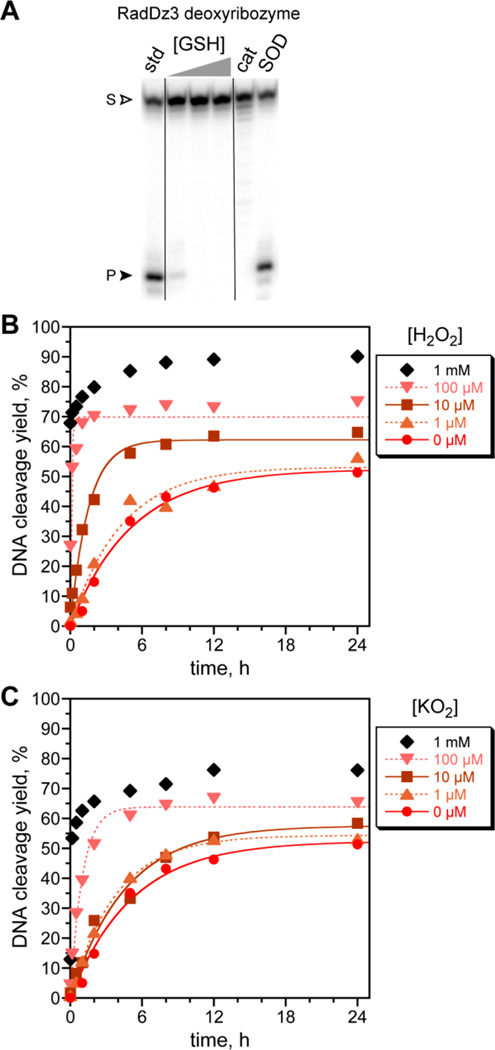
Inhibition of RadDz3 catalysis by glutathione or catalase; indifference to superoxide dismutase (SOD); and enhancement of catalysis by H2O2 and potassium superoxide (KO2). All assays used the incubation conditions of Figure 2 with 1 mM Zn2+, 20 mM Mn2+, and 40 mM Mg2+. (A) Assays including glutathione (1, 3, or 10 mM), catalase (1 U/20 µL), or SOD (1 U/20 µL). All time points at 24 h. (B) Assays including H2O2. kobs values (at indicated [H2O2], h−1): 0 µM, 0.19; 1 µM, 0.24; 10 µM, 0.66; 100 µM, 10. The first data point for 1 mM H2O2 is at 30 s. (C) Assays including KO2. kobs values (at indicated [KO2], h−1): 0 µM, 0.19; 1 µM, 0.26; 10 µM, 0.22; 100 µM, 1.0.

