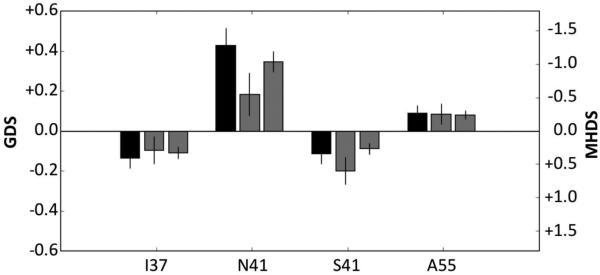
Fig. 2.
Vpr amino acid variants are associated with differences in GDS. The change in GDS (left y-axis and black bars) in 112 CNPA-evaluated patients is plotted with respect to the position and identity of the amino acid. The middle gray bars show the effect sizes on MHDS (right y-axis) for the same 112 patients. The right gray bars show the effect sizes on MHDS in all patients (543 patients who were evaluated with both CNPA and MHDS or MHDS only). Error bars indicate 95% confidence intervals on estimated effect sizes.

