Fig. 3.

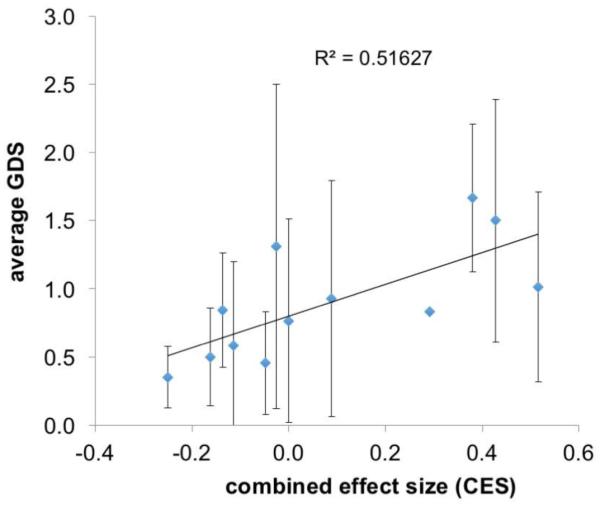
Average patient GDS is positively correlated with the combined effect size (CES). The summed effect sizes for each patient sequence are plotted against average GDS for each of the 12 possible combined effect size groups.

Average patient GDS is positively correlated with the combined effect size (CES). The summed effect sizes for each patient sequence are plotted against average GDS for each of the 12 possible combined effect size groups.