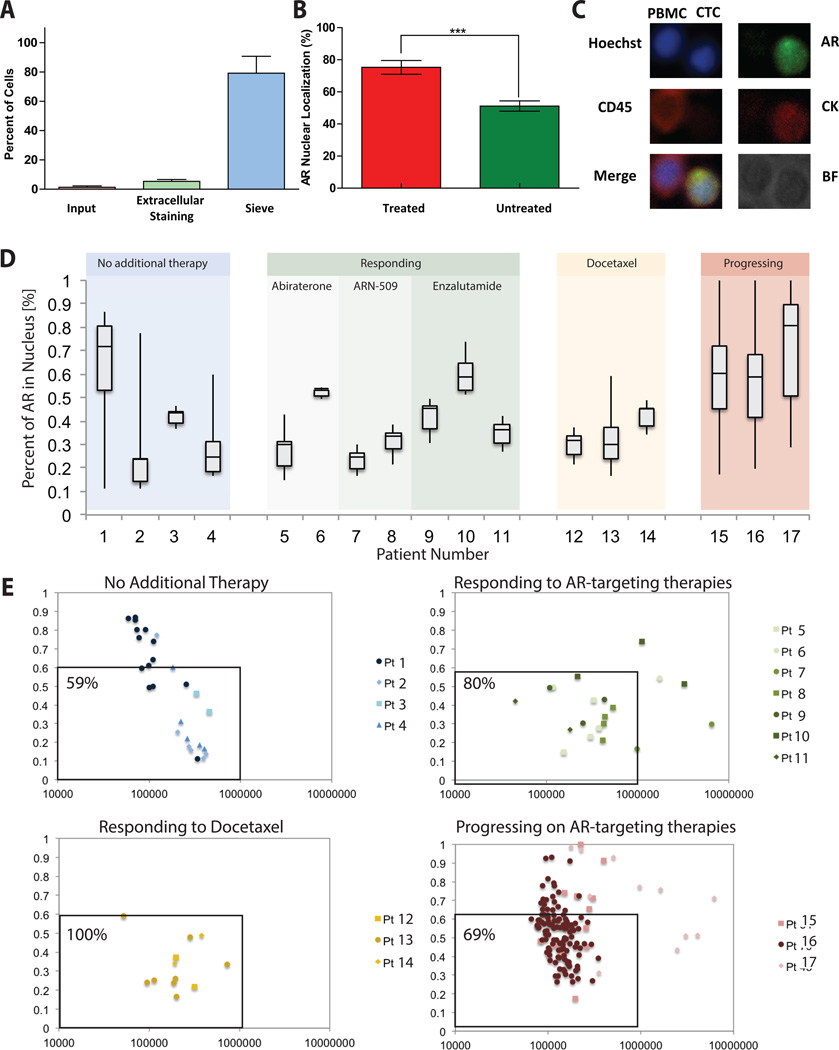
Figure 2. AR quantification and nuclear localization in CRPC patients.
(A) Approximately 25 calcein-labeled LNCaP cells were spiked into the input well and imaged. Following VERSA procedure, input, extracellular staining and sieve wells were again imaged and LNCaPs counted to determine percent of cells in each well. (B) AR nuclear localization of AR transfected cos-7 cells stimulated with and without mibolerone (AR agonist). Stimulated cells (n=30, mean±SD) showed significantly higher AR nuclear localization as compared to unstimulated cells (p<0.0004). (C) A representative patient PBMC and CTC is shown here stained with CD45 (PBMC) or AR and Cytokeratin (CTC). (D) The percent nuclear localization is shown for 17 CRPC patients grouped by patient treatment and response. Box plots show average and spread (min to max) of the localization percent within CTCs for each patient across different classes of therapy. (E) For each individual CTC within a patient total AR Intensity and AR nuclear localization percentage were plotted for different patient groups.

