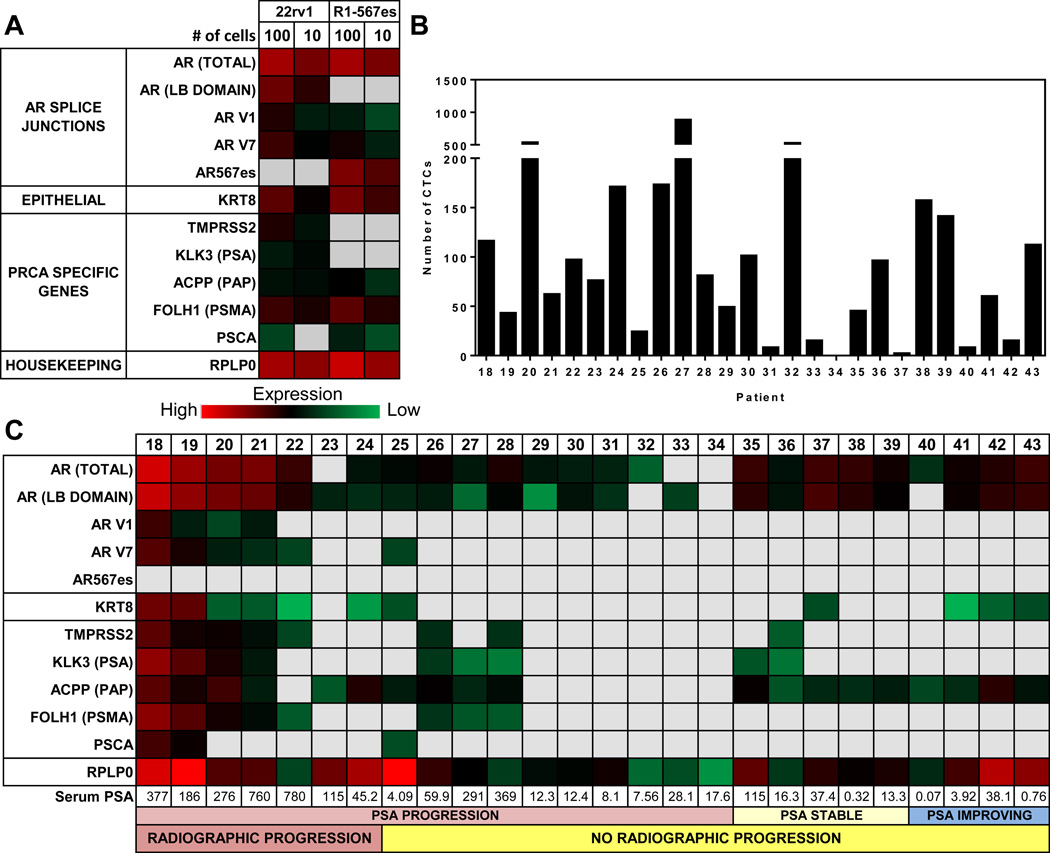
Figure 3. Gene expression analysis of the AR signaling pathway.
(A) Results from quantitiative RT-PCR are presented as Ct values represented as a heat map. mRNA was isolated from the indicated number of cells (n=3) from either 22rv1 or R1-D568 cell lines. (B) Enumeration of CTCs (defined as the number of cells with intact nuclei, CK+, CD45−/7.5 mL blood) from a fixed sample run in parallel to gene expression analysis. (C) mRNA was isolated from Epcam positive fraction from15 mL of EDTA anticoagulated blood. mRNA was reversed transcribed, pre –amplified and probed for the AR gene splice junctions including multiple splice variants and PRCA specific genes.

