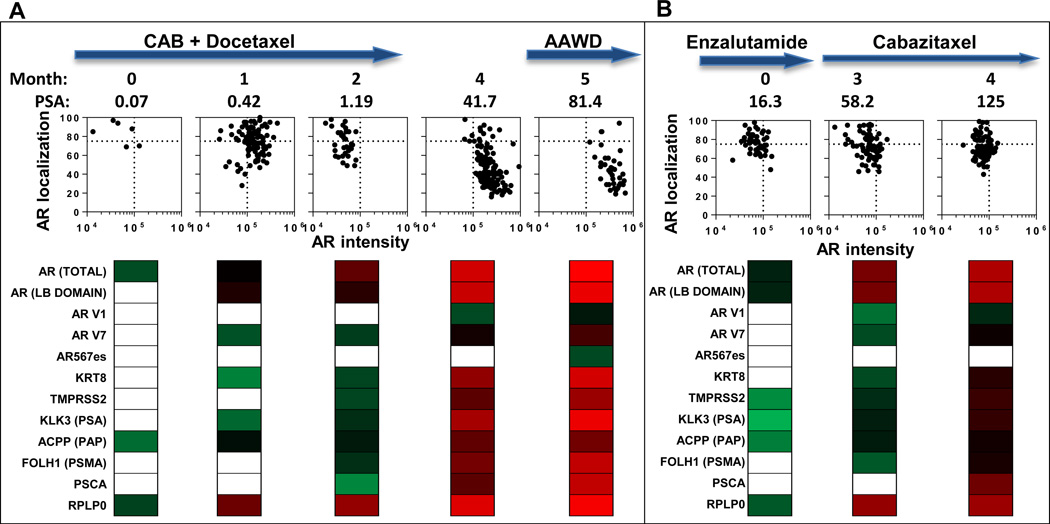
Figure 4. Longitudinal analysis of patients with CRPC.
(A) Pt 40, and (B) Pt 36 were monitored as they progressed through the indicated treatments. Treatment is indicated at the top. The initial blood draw (Month 0) corresponds to (A) cycle 3 of chemohormonal therapy for Pt 40 and (B) cycle 2 of Enzalutamide treatment for Pt 36. For each patient, and at each time point, we present AR nuclear localization verses intensity (each point representing a single CTC). Below each plot, we show panels with gene expression data (represented as a heat map of Ct values). CAB (Combined Androgen Blockade), AAWD (Anti-Androgen Withdrawl)

