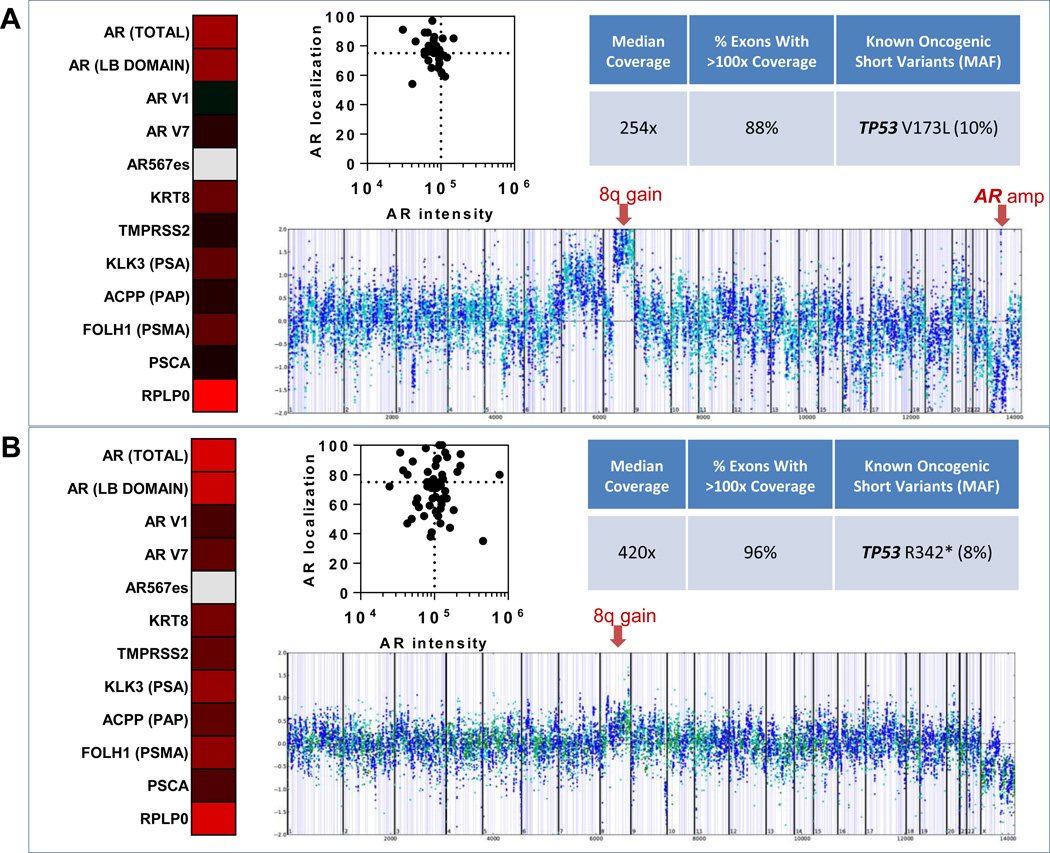
Figure 5. Multi-parametric analysis of gene expression, genomic profiling and AR protein analysis from captured CTCs.
(A) Gene expression and AR protein analysis in a single blood draw from patient 19, and genomic profiling from a subsequent blood draw from this patient. (B) Results shown are from a single blood draw from patient 18. Gene expression data is shown as a heatmap, where red indicates high expression, black median expression, green low expression, and gray no detectable expression. AR protein analysis of CTCs is reported as a graph of AR nuclear localization verses AR intensity. Sequencing coverage and known oncogenic short variants detected using FoundationOne comprehensive genomic profiling are shown along with corresponding copy number plots (each dot represents coverage ratio compared to normal for all exon and intron targets as well as SNPs). Prostate cancer-specific copy number changes are indicated with red arrows (gain of 8q in both patients and focal amplification of AR in patient 19 (A).

