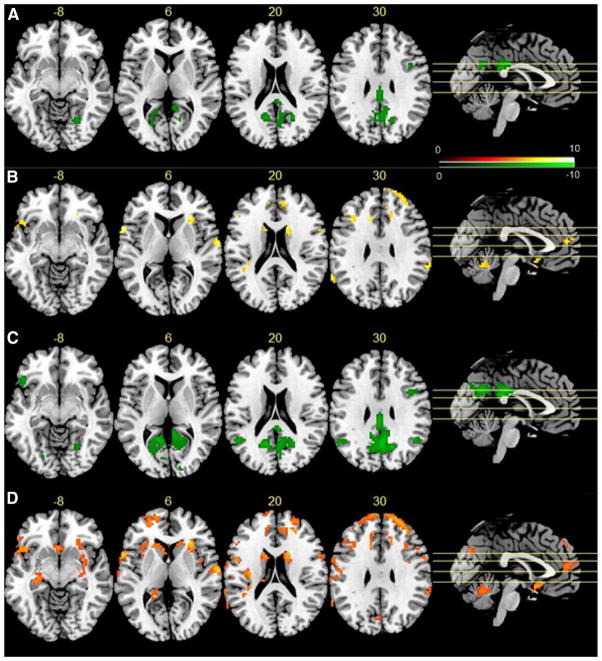
Fig. 4.
Age and gender effects on rsfMRI TTFs. The green spots in a, c indicate negative correlations between age and nMSSD, and VSD, respectively; hot spots in b, d mean the males had higher nMSSD or VSD, respectively, in those regions. Significance level was defined by p < 0.05 (FWE corrected), and cluster size >30 voxels. L the left side of the brain. The digital numbers to the right of each axial image and the blue lines in the sagittal image indicate the physical locations along z direction (mm) of the corresponding axial images in MNI space

