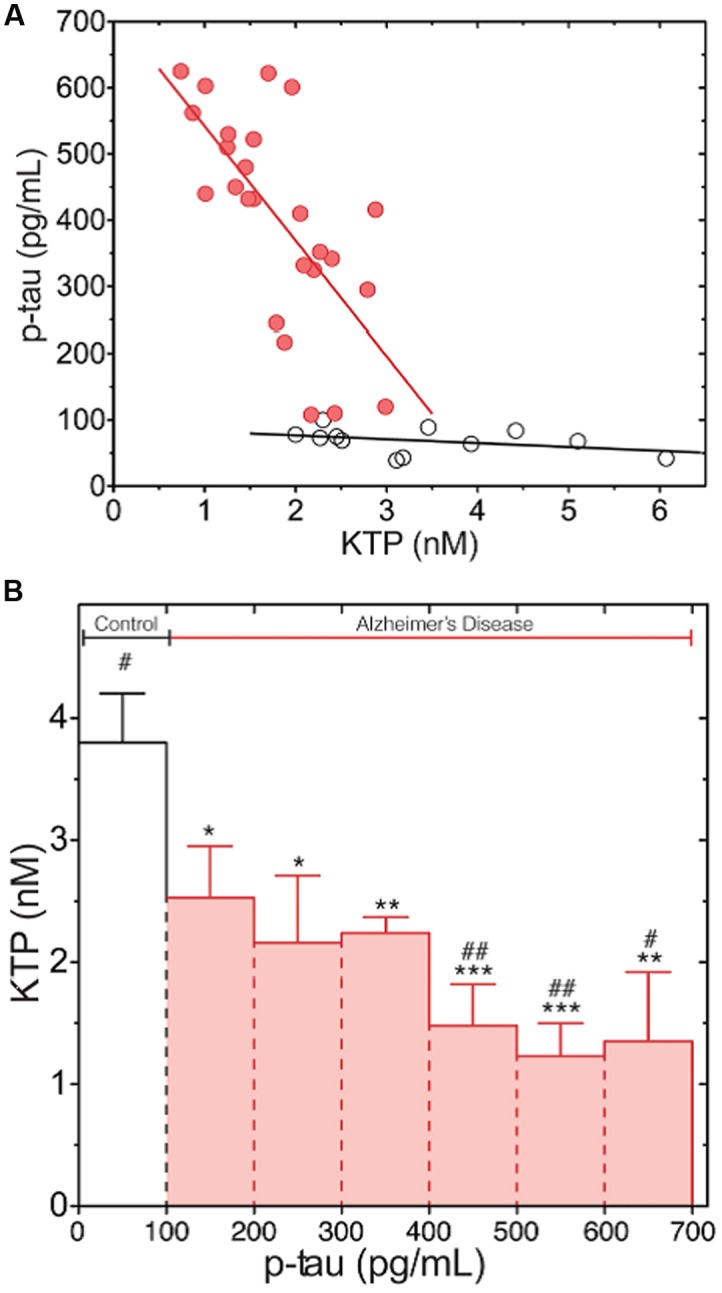
FIGURE 2.

Phosphorylated-tau (p-Tau) levels dependence on KTP concentration both in AD (red) and normal group (white). (A) Complete data set with individual values (linear regression line plotted as a guide to the eye). (B) The data set presented in (A) was clustered in classes according to regular intervals of amplitude of 100 pg/mL of p-tau concentration and averaged for KTP concentration (error bars: standard error). The average KTP value of all classes was compared to control (∗p < 0.04, ∗∗p < 0.0075, ∗∗∗p < 0.0006) or the 100- to 200-pg/mL p-tau class (#p < 0.04, ##p < 0.0046) using the one-way ANOVA with Dunnett’s post-test (Santos et al., 2013).
