
FIGURE 1.
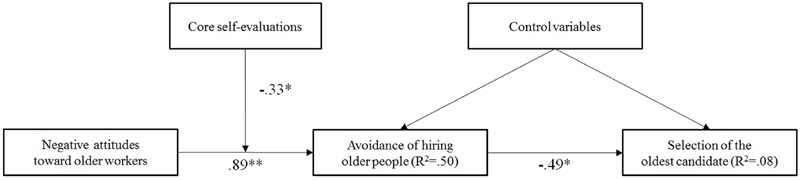
Estimated path model showing relationships between negative attitudes toward older workers, core self-evaluations, avoidance of hiring older people, and selection of the oldest candidate with unstandardized coefficients (N = 100). ∗p < 0.05, ∗∗p < 0.01.