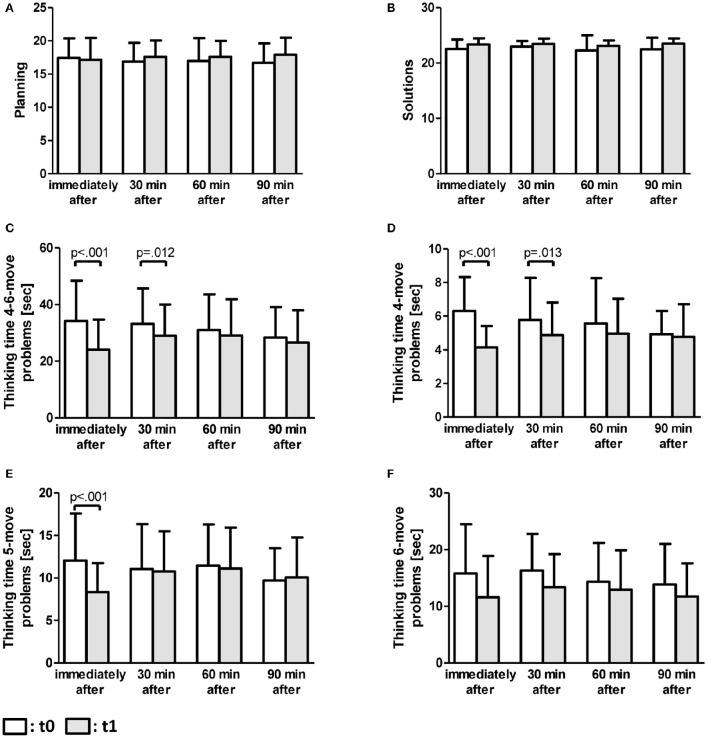
Figure 2.
ToL-F results. ANCOVA results are presented as means (±standard deviation) for each parameter separately for time points t0 and t1, controlled for age, school years, and fitness level (A–F). (A) Planning, (B) Solutions, (C) Median thinking time for all 4-6-move problems together, (D) Median thinking time for 4-move problems, (E) Median thinking time for 5-move problems, (F) Median thinking time for 6-move problems. Significant SEA results are pointed out by p-values.

