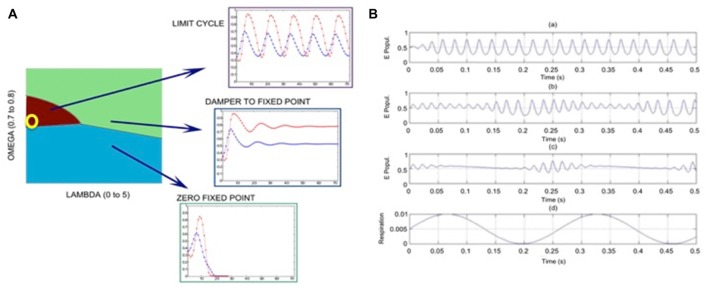
Figure 2.
Results of calculations using graph theory models of coupled excitatory-inhibitory populations; the following parameter values are used: proportion of excitatory units OMEGA = 0.75, expected number of long axonal connections (shortcuts) is LAMBDA = 0.0017. (A) Phase diagram with parameter regions with the dominance of limit cycle oscillations (purple), nonzero fixed point (light green) and zero-fixed point (blue) regimes; the yellow circle corresponds to parameter settings used in (B) plot at the edge of the limit cycle regime, close the fixed point regime. (B) Illustration of the phase-locked amplitude modulation of the gamma oscillations (of excitatory population) in response to periodic input (respiration) perturbations of increasing amplitude (RA); (Ba) RA = 0.001; (Bb) RA = 0.02; (Bc) RA = 0.03; (Bd) shape of the respiratory sinusoid signal. The amplitude modulation of the inherent high-frequency oscillation (around 60 Hz) is locked to the respiratory cycle, so that the high-frequency component has increased magnitude during the increasing segment of the input signal from its minimum value.

