FIGURE 4.
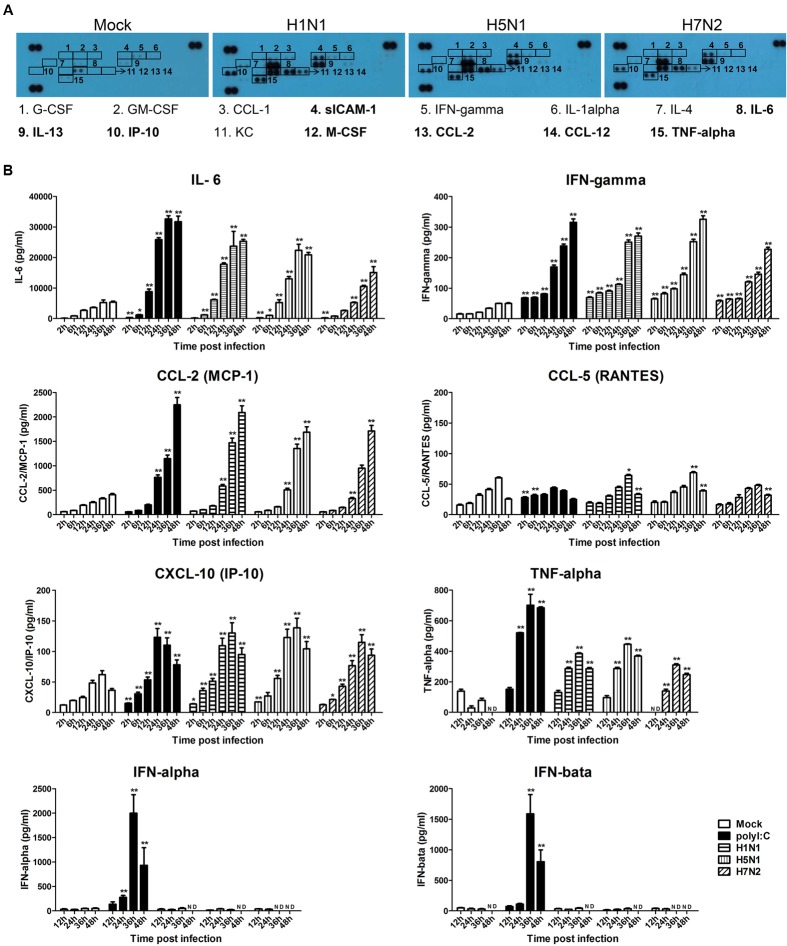
Influenza virus infection causes the release of pro-inflammatory cytokines and chemokines. (A) P815 cells were infected with H1N1, H5N1, and H7N2 at a MOI of 0.1, or mock treated for 24 h. Cell-free supernatants were then analyzed for cytokine and chemokine content using a cytokine array panel. Numbered boxes denote up-regulated expression, with the most dramatic increases annotated in bold. Results shown are representative of two separate experiments. (B) P815 cells were infected with H1N1, H5N1, and H7N2 at a MOI of 0.1, exposed to LE-PolyI:C, or mock treated. At the designated time points, cell supernatants were harvested and the expression of IL-6, IFN-γ, CCL-2, CCL-5, IP-10 TNF-α, IFN-α, and IFN-β was analyzed by ELISA. Graphs shown are mean ± SD of three independent replicates. Asterisks indicate statistically significant increases compared to mock treatment (∗P < 0.05, ∗∗P < 0.01). ND, not detectable.

