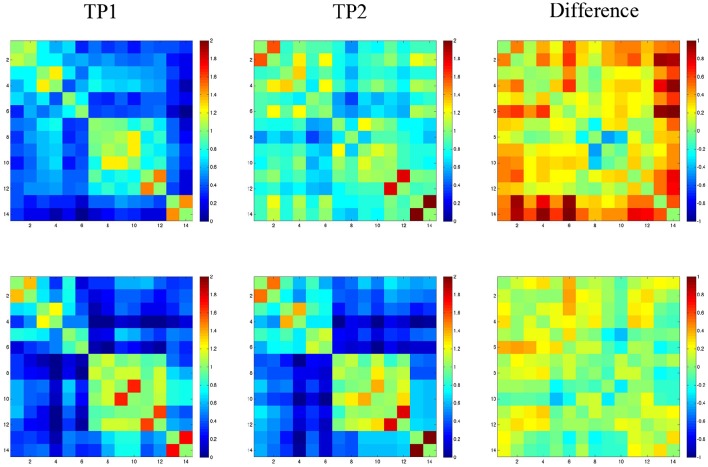
Figure 3.
Fisher-transformed correlation matrix for the resting state data for SMY (top panel) at time point 1 (TP1: prior to the start of treatment) and time point 2 (TP2: 2-months follow up time point). Control participant's data is shown in the bottom panel. Difference map shows the difference in correlation between the scan for the resting state data. Correlations were assessed across 14 ROIs. Regions are labeled as numbers corresponding to the left and right superior frontal gyrus (SFG; region 1 and 2), superior frontal gyrus_prefrontal cortex (SFG_PFC; region 3 and 4), middle frontal gyrus dorsolateral prefrontal cortex (MFG_DLPC; region 5 and 6), middle temporal gyrus pole (MTG_pole; region 7 and 8), inferior temporal gyrus (ITG; region 9 and 10), fusiform gyrus (FG; region 11 and 12), and cerebellum (region 13 and 14).

