Figure 10.
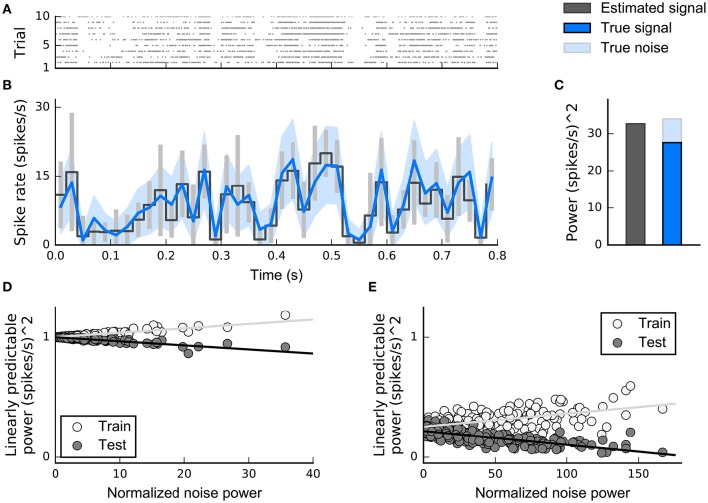
Signal power, noise power, and population extrapolation. Simulated data illustrate principle of quantification of predictable signal power. (A) Raster plot showing Poisson spike trains for 10 presentations of the same stimulus. (B) True signal (solid blue line) that was used to generate the spike trains, together with true noise (blue shaded area). The spike rate (black line) and the standard deviation across trials (gray bars) were estimated by counting spikes in discrete bins. (C) Power of estimated response, true signal, and true noise. The estimated response power overestimates the true signal power by the noise power (additivity of variances, see text). The estimated signal power is found by subtracting the noise power from the estimated response power. (D) Normalized predictive power for a population of 200 simulated linear-Gaussian cells. Predictions on training data (light gray circles) and testing data (dark gray circle) were done using a linear estimator. As expected, extrapolation to zero noise power reveals that the model accounts for the maximum linearly predictable power. (E) The same as in (D) but responses were simulated using 200 linear-nonlinear Bernoulli cells and a non-Gaussian stimulus (similar to the stimulus in Figure 3B). Extrapolation to the zero noise condition indicates that imperfect model performance is due to an incorrect model assumption (linear-Gaussian model) rather than to noise.

