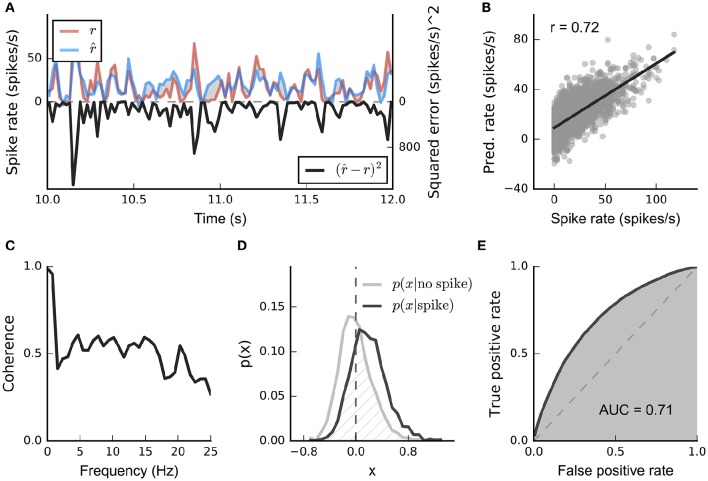
Figure 9.
Common techniques for evaluating SRFs. (A) The mean squared error (MSE) measures the squared error (black line) per time step between the measured rate (red line) and predicted rate (blue line). The error between the rates (gray shaded area) depends on mean and scaling of the rates. (B) The correlation coefficient reflects the linearity between measured and predicted response, indicated by the least squares line fit. The correlation is invariant to linear transformations, i.e., its value does not depend on the mean and the scaling of the responses. (C) The coherence assesses the linear relationship between two variables in frequency space; i.e., it is a frequency-dependent correlation measure. (D) Conditional distribution of filtered stimuli that elicited a spike (black line) or no spike (gray line). The hatched area indicates the overlap between the two distributions, which is related to prediction performance in a binary coding model (see text for details). (E) A receiver-operating characteristic curve (ROC) can be constructed from the distributions in (D) by computing false positive and true positive rates for all possible thresholds along the x-axis. The area under the ROC curve (AUC; shaded gray area) provides a scalar measure of the prediction performance of the fitted model.

