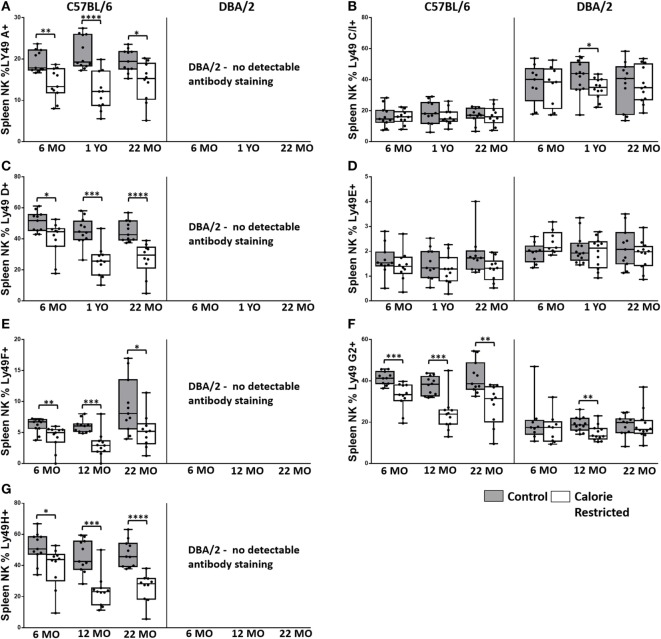
Figure 4.
Ly49R expression changes with calorie-restricted (CR) and age. Characterization of murine splenic natural killer (NK) cells in control (shaded boxes) and CR mice (open boxes) at 6 months (6 MO), 12 months (12 MO), and 22 months (22 MO) of age in C57BL/6J and DBA/2J mice. Significant differences between strains are shown in parentheses. (A–G) Plots represent the percentage NK cells (NKp46+, CD3−) expressing (A) Ly49A, (B) Ly49C/I (6 MO C***, CR***; 12 MO C****, CR****; 22 MO C*, CR***), (C) Ly49D, (D) Ly49E (6 MO CR***; 12 MO CR*; 22 MO CR*), (E) Ly49F, (F) Ly49G2 (6 MO C**, CR***; 12 MO C****, CR**; 22 MO C****, CR*), and (G) Ly49H. For gating, see Figure S4 in Supplementary Material. Horizontal bars represent median values, boxes extend from the 25th to the 75th percentile, and whiskers represent the min to max range. p Values are derived from non-parametric Mann Whitney U tests. ****p ≤ 0.0001, ***p < 0.001, **p < 0.01, and *p < 0.05. Numbers of mice per group ranged from 10 to 13.

