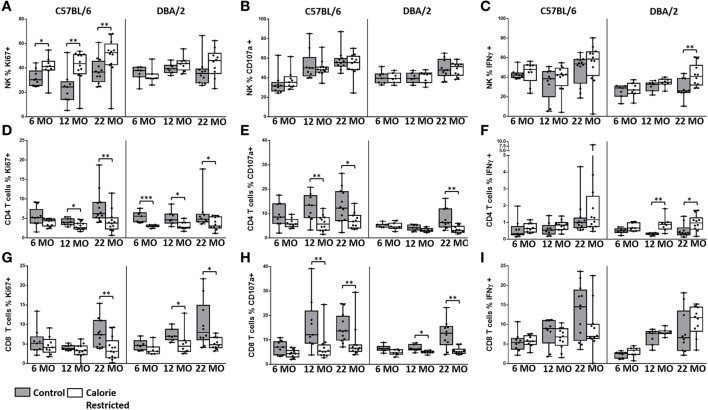
Figure 8.
Natural killer (NK) cell and T cell function are altered by age and calorie-restricted (CR). Characterization of murine splenic NK cells and T cells in control (shaded boxes) and CR mice (open boxes) at 6 months (6 MO), 12 months (12 MO), and 22 months (22 MO) of age in C57BL/6J and DBA/2J mice. Significant differences between strains are shown in parentheses. Splenic lymphocytes were stimulated for 18 h with IL-12 (5 ng/ml) and IL-18 (20 ng/ml) (A–C,E,F,H,I) or 100 ng/ml IL-2 (D,G). (A–C) Percentage of NK cells (NKp46+ CD3−) expressing (A) Ki67 (12 MO C*), (B) CD107a (6 MO C*; 12 MO C*, CR**), and (C) IFNγ; (D–F) percentage of CD4+ T cells (CD3+ CD4+ or NKp46−) expressing (D) Ki67, (E) CD107a (6 MO C**; 12 MO C**; 22 MO C*, CR**), and (F) IFNγ (22 MO C**); (G–I) percentage of CD8+ T cells (CD3+ CD4− NKp46−) expressing (G) Ki67 (12 MO CR***), (H) CD107a (12 MO C*), and (I) IFNγ (6 MO C**, CR**). For gating, see Figure S6 in Supplementary Material. Horizontal bars represent median values, boxes extend from the 25th to the 75th percentile, and whiskers represent the min to max range. p Values are derived from non-parametric Mann Whitney U tests. ****p ≤ 0.0001, ***p < 0.001, **p < 0.01, and *p < 0.05. Numbers of mice per group ranged from 10 to 13.

