
Fig. (2).
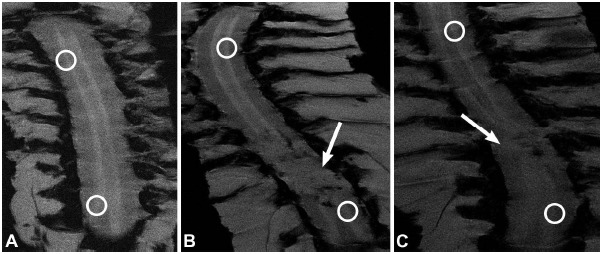
Coronal MEMRI images of spinal cords. (A) Control+Mn animal; (B) SCIH+Mn animal; and (C) SCIT+Mn animal. Circles indicate areas of spinal cord rostral and caudal to SCI epicenter where T1-signal intensities were measured. Arrows indicate regions of SCI. Used with permission from Barrow Neurological Institute, Phoenix, Arizona.