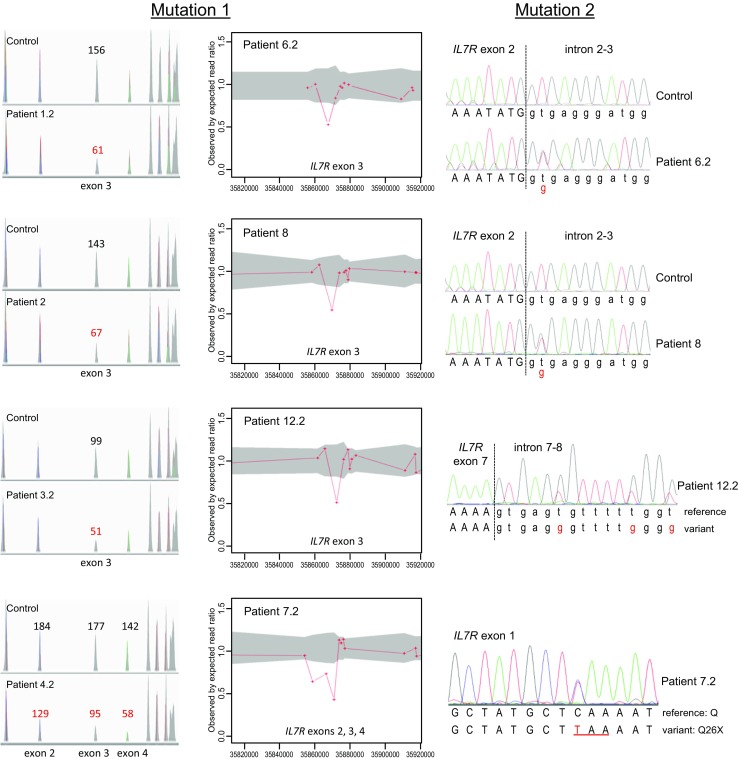
Fig. 2.

Compound heterozygous IL7R mutations. Mutation 1—hemizygosity of exon 3 or exons 2-4 demonstrated by ExomeDepth. Shown for each exon are peaks representing read depth (left) and the observed to expected ratio of reads (right). Gray area expected value range. Affected exons have fewer reads than those of other samples of the same batch. Mutation 2—Sanger sequencing of heterozygous SNVs (indicated in red)
