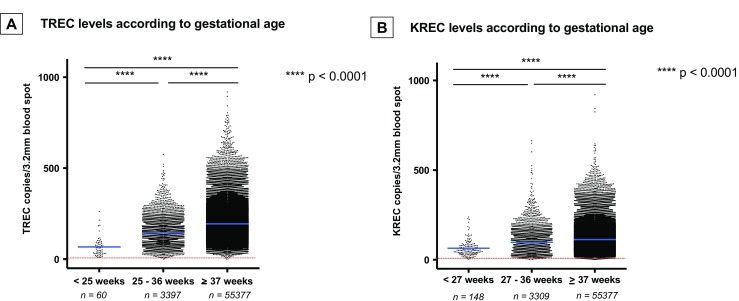
Fig. 3.

Comparison of TREC levels (a) in infants born prior to 25 weeks, between 25 and 36 weeks, and at term (≥37 weeks) gestation. Comparison of KREC levels (b) in infants born prior to 27 weeks, between 27 and 36 weeks, and at term (≥37 weeks) gestation. Each point represents one infant and the number of infants in each group is indicated. The horizontal blue line indicates the mean value of all samples. The dashed horizontal red line represents the cutoff value for TREC (<10 copies/3.2 mm blood spot) and KREC (<6 copies/3.2 mm blood spot) levels, respectively. ****p < 0.0001, Mann-Whitney U test
