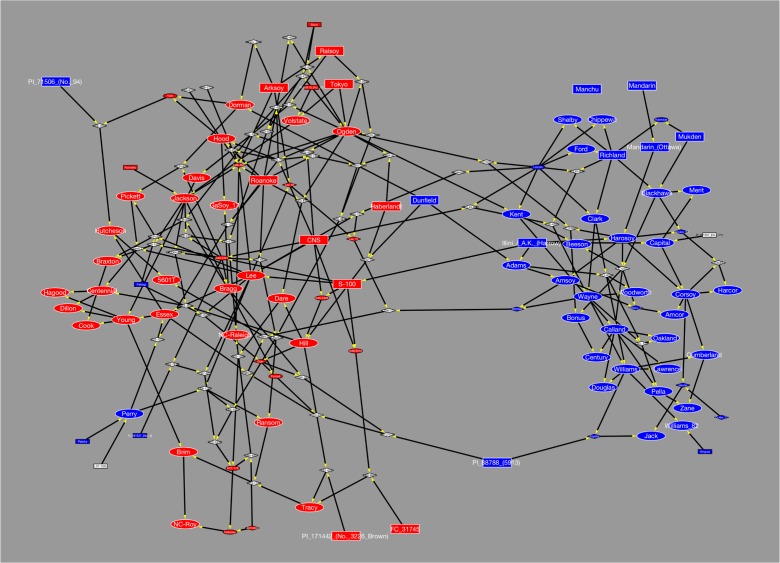
Fig. 1.
Separation of southern and northern genotypes. Pedigree data for all genotypes are shown as a directional network, in which soybean genotypes are represented as nodes and their relationship as edges. Edge points from parental lines to progeny lines as indicated by the yellow arrowheads. Landraces, milestone cultivars, and intermediate breeding lines are shown as rectangles, ellipses, and diamonds, respectively. Nodes shown in blue represent soybean lines belonging to maturity groups 0–IV, while nodes in red indicate lines with maturity ratings V–VIII. Genotypes whose maturity data were not available are shown as white nodes. Genotypes associated with large nodes surrounded by white borders were sequenced. The network analysis reveals two main clusters containing soybean lines adapted to more northern or southern growing zones (color figure online)

