
Figure 6.
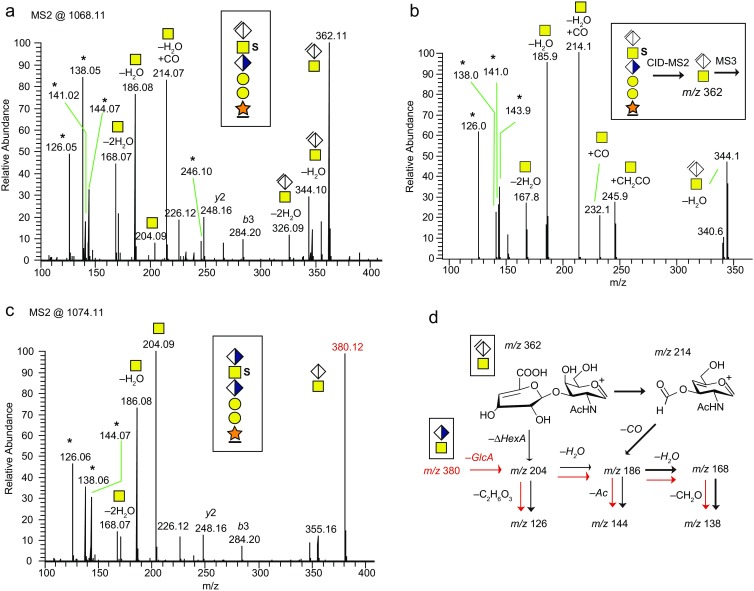
Oxonium ion analysis of protonated CS-glycopeptides originating from the monosulfated glycoform. (a) HCD spectrum of the m/z 100–400 region showing the oxonium ions. (b) CID-MS3 of the [ΔHexAGalNAc]+ ion at m/z 362.11. (c) HCD spectrum at the m/z 100–400 region for the mono-sulfated glycoform containing an intact terminal GlcA residue. (d) Proposed decomposition pathways for the m/z 362.11 and 380.12 (red) ions. All major oxonium ions are annotated with glycan structures and ions marked with * are specified in Table 2. HCD and CID were performed at a NCE of 30%