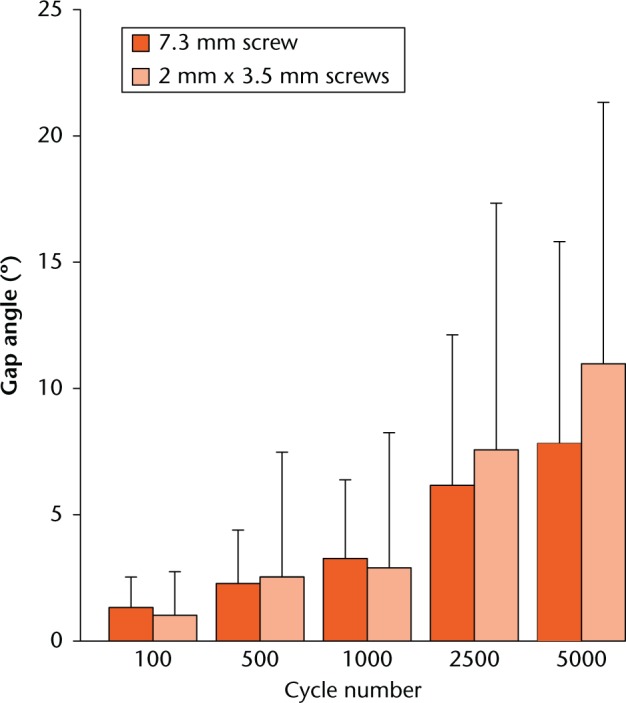
Fig. 4.

Diagram representing the values for gap angle of the two fragments relative to each other after 100, 500, 1000, 2500 and 5000 cycles in the two study groups in terms of mean and standard deviation.

Diagram representing the values for gap angle of the two fragments relative to each other after 100, 500, 1000, 2500 and 5000 cycles in the two study groups in terms of mean and standard deviation.