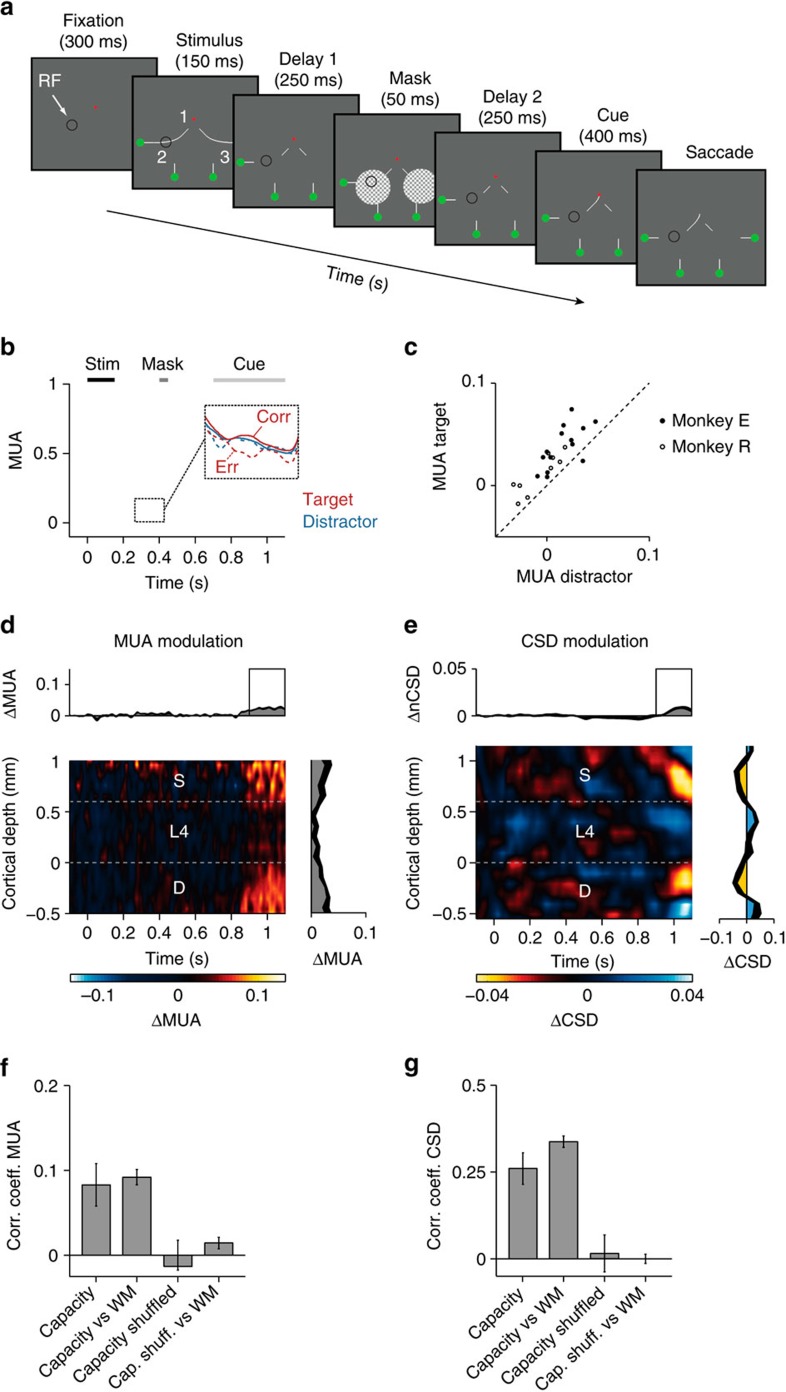
Figure 7. Capacity limitations in working memory.
(a) The contours in or near the RF disappeared after 150 ms and a mask (50 ms) appeared after 250 ms, followed by a second delay of 250 ms. The connection to the fixation point was shown after the second delay, cueing one of the curves as target. (b) Average MUA response evoked by the target (red trace) and the distractor curve (blue). Shaded areas show s.e.m. (n=23 penetrations). Inset, activity elicited by the future target and distractor curve on correct (continuous curves) and erroneous trials (dashed) before the central cue identified the target. Note that reduced memory activity for the target curve is predictive of an error. (c) MUA elicited by target (ordinate) and distractor (abscissa) from 850 to 1100, ms after stimulus onset. (d,e) Difference in MUA (d) and CSD (e) elicited by target and distractor curve. (f,g) The left bar represents the average correlation coefficients of the laminar pattern of the MUA (f) and CSD (g) between penetrations, from 850 to 1,100 ms. The second bar (capacity versus WM) compares the laminar profile to that in the memory task of Fig. 2d. Error bars show s.e.m.

