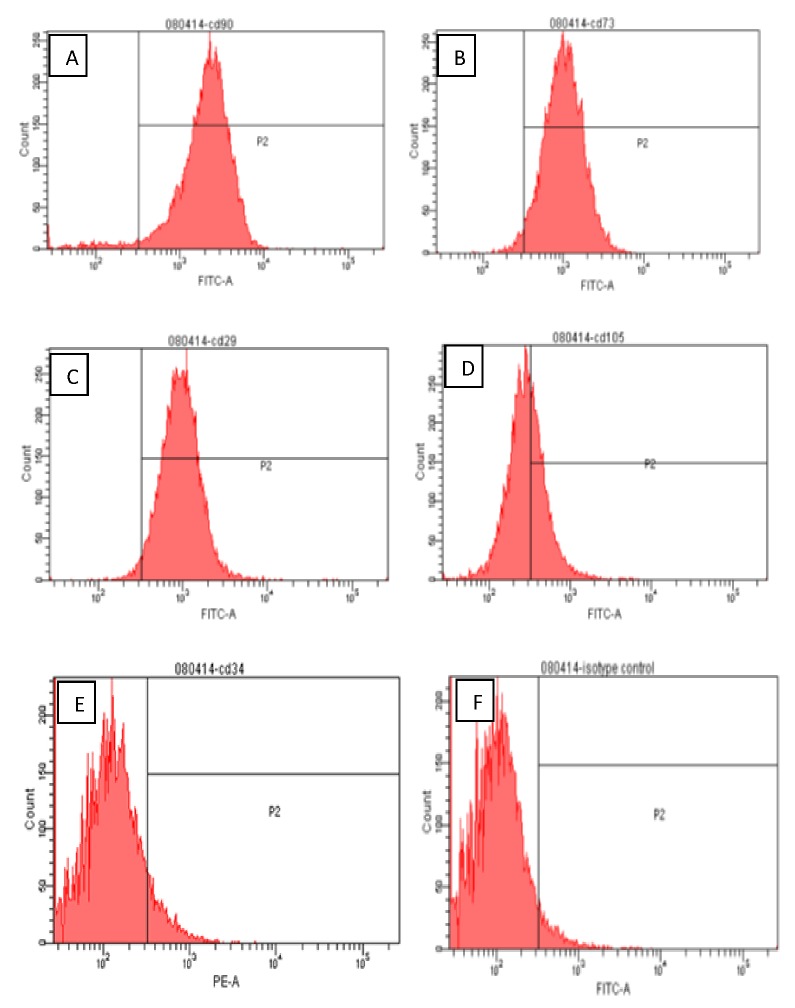
Figure 2.
Flow cytometric surface marker expression profile: The side scatter (SSC) and forward scatter (FSC) were adjusted accordingly to gate the population of interest. The gate P1 in the SSC vs. FSC plot, represents the experimental population of ASCs. The gate P2 is referred as the interval gate enclosing the positive cell population in each fluorescence parameter. The positive expression levels of cell surface markers in human ASCs were clearly shown in the figures: [A]. CD 90 (85%), [B]. CD 73 (89%), [C]. CD 29 (85%) and Only35% of ASC population express [D]. CD 105. Also, ASCs were found to be negative for [E]. CD34 (8.8%). [F]. Isotype control IgG1.

