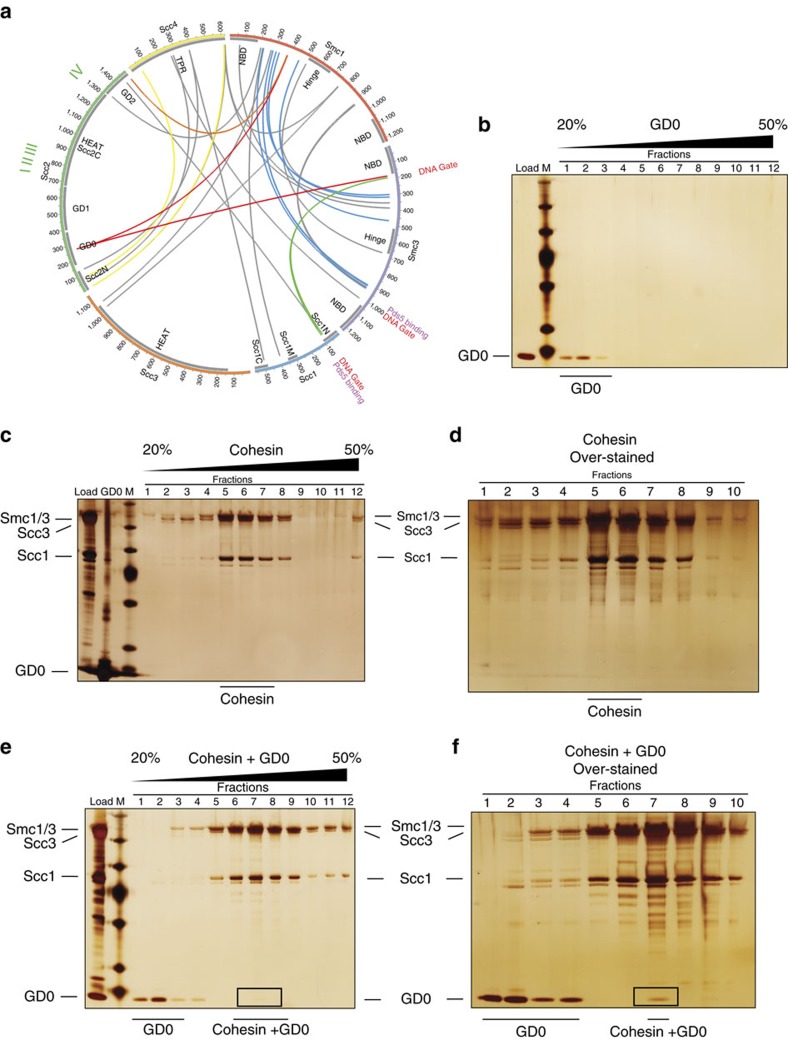
Figure 4. Cohesin–loader interaction analysis.
(a) Diagram indicating intermolecular crosslinks (n=30) between cohesin subunits and Scc2–Scc4. Grey boxes are structured domains of cohesin and Scc2–Scc4 (Smc-coiled coils are not indicated). Red crosslinks indicate interaction between GD0 and cohesin. Crosslinks that are consistent with the published human cohesin crosslinks12 are in blue. Crosslinks that are consistent with published Smc3–Scc1N and Scc2N–Scc4 crystal structures7,32 are in yellow. Crosslinks that are consistent with both the published human cohesin crosslinks and crystal structures are in green. A crosslink that would require a conformation change in the loader to occur for distance restraints to be satisfied is in orange. Positions of Scc2 mutations I–IV, DNA-entry/exit gate9 and the documented Pds5-binding sites12,28,29,38 are marked. (b) Silver-stain gel showing glycerol gradient fractions of GD0 domain. M indicates protein marker. (c) Silver-stain gel showing glycerol gradient fractions of cohesin. (d) Over-stained silver-stain gel showing glycerol gradient fractions of cohesin. (e) Silver-stain gel showing glycerol gradient fractions of S. cerevisiae cohesin plus GD0 domain. (f) Over-stained silver-stain gel showing glycerol gradient fractions of cohesin plus GD0 with cohesin-bound GD0 being more visible.

