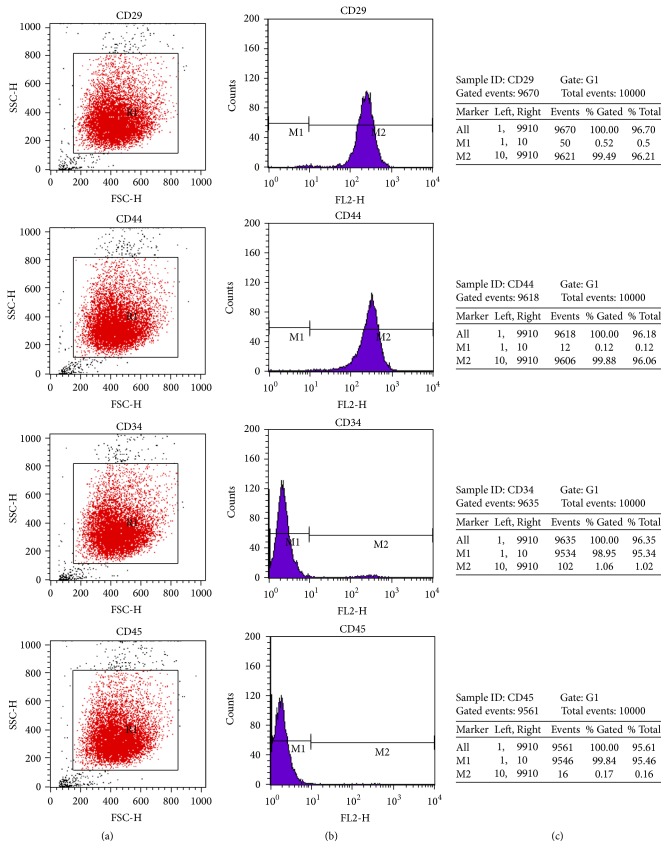
Figure 2.
Expression of CD29, CD34, CD44, and CD45 on the surface of hBM-MSCs. Flow cytometry analysis was performed to detect the CD29+/CD44+/CD34−/CD45− cell population on day 14 of cell culture. (a) Expression of CD29, CD44, CD34, and CD45 on hBM-MSCs cells from each group. (b) M1 marker gates of the CD29−/CD44−/CD34−/CD45− cells and M2 marker gates of the CD29+/CD44+/CD34+/CD45+ cells. (c) The percentage of the CD29+/CD29−, CD44+/CD44−, CD34+/CD34−, and CD45+/CD45− cells is indicated within the hBM-MSCs cell population.

