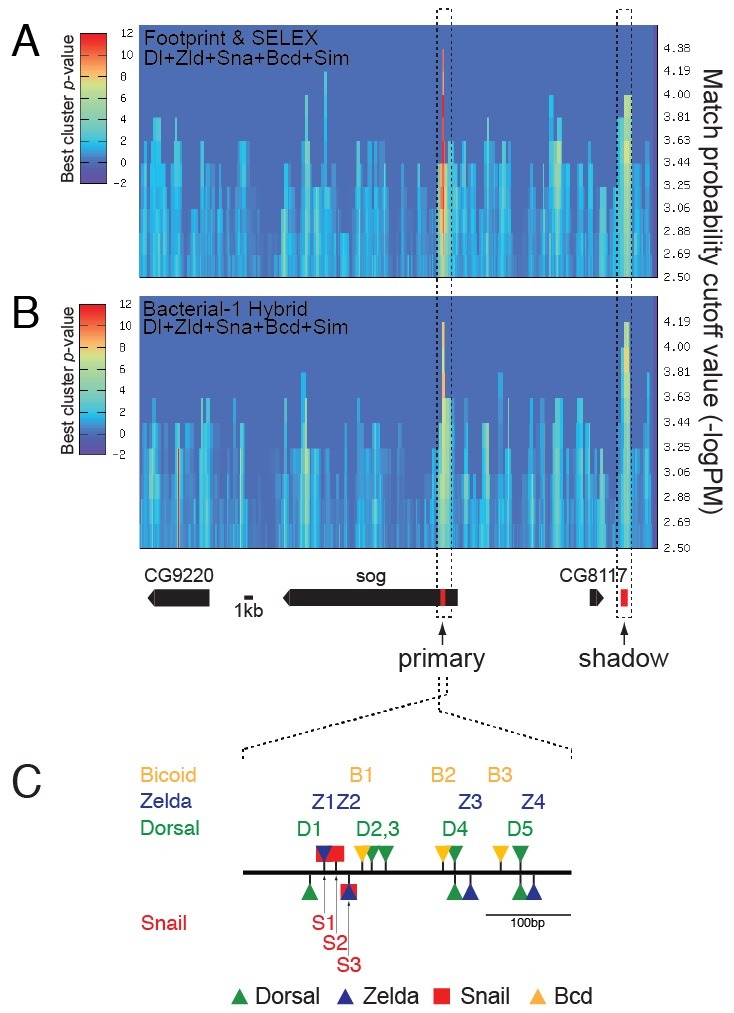
Fig. 2. ClusterDraw analyses across a ∼62-kb genomic region encompassing the sog locus. ClusterDraw analyses were performed with two different types of PFMs for the Dorsal (Dl)-, Zelda (Zld)-, Snail (Sna)-, Bicoid (Bcd)- and Single-minded (Sim)-binding sequences. One was built by motif alignments obtained from in vitro binding data (10) (A) and the other from in vivo binding data (11) (B). Each analysis yielded two statistically significant best cluster P values. Although the patterns of the best cluster P values along the axis of match probability cutoff (−logP) (x axis) differed slightly between the two independent analyses, the two best clusters in each analysis coincided with the primary and shadow enhancers (dotted boxes, Table S6). No Sim-binding sites were identified in the sog primary enhancer. Gene models over the 62-kb genomic region are depicted below panel B. (C) ClusterDraw analyses also indicated the location and cumulative match probability (−logP) value of each motif found in the primary enhancer (Tables S2-S5). The thick line denotes ∼400-bp of the sog primary enhancer (Table S6) (5). Triangles and squares shown above and below the line represent motifs identified in the sense and antisense strands relative to the transcription start sites of the sog gene, respectively.