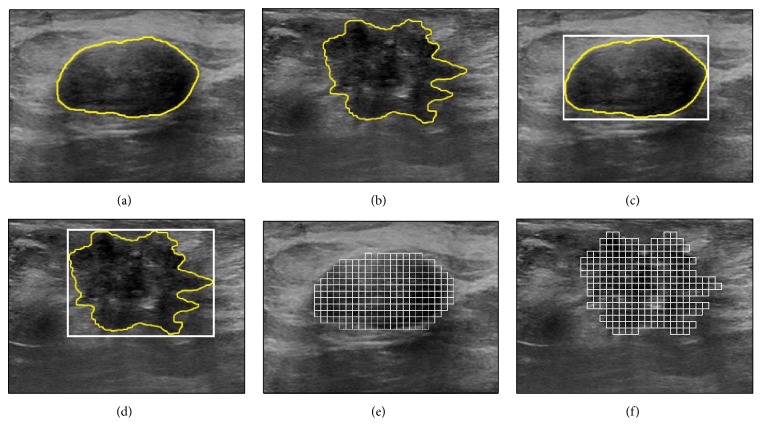
Figure 1.
(a)-(b) BUS images of (a) benign and (b) malignant tumors with manually drawn outlines (yellow line). (c)-(d) A single ROI is drawn around each tumor in (a) and (b), such that the ROI corresponds to the minimum bounding rectangle that contains the tumor. Such ROI is often used in conventional texture analysis. (e)-(f) Each tumor in (a) and (b) is divided into a set of nonoverlapping ROIs. These multiple ROIs are used in the proposed approach to extract the texture features.

