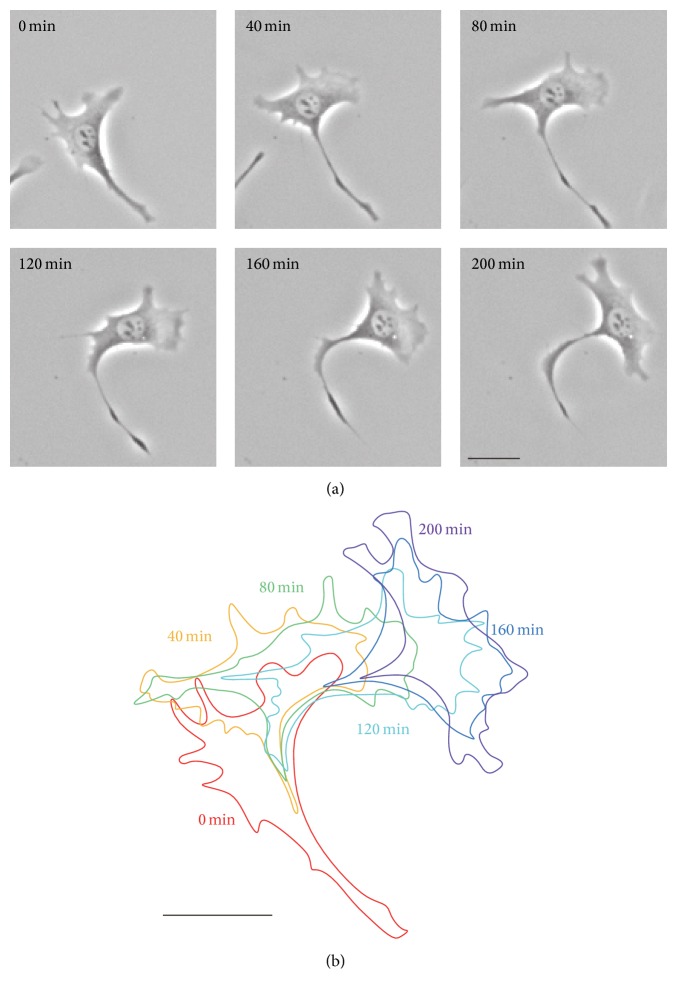
Figure 2.
A typical example of an image sequence of a Swiss 3T3 fibroblast exhibiting turning behavior. (a) Sequential phase contrast images of the cell every 40 minutes for up to 200 minutes. The cell turned with the collapse of the initial leading edge, followed by the formation of new lamellipodia, orthogonal to the original direction of migration. In this study, a total of 19 cells were observed and 10 cells showed more than 90° turning with large deformation during slow migration. Four of these 10 cells in particular showed such turning behavior. (b) Time sequence of the manually extracted outline of the cell in (a), with color denoting time elapsed. Scale bars: 20 μm.

