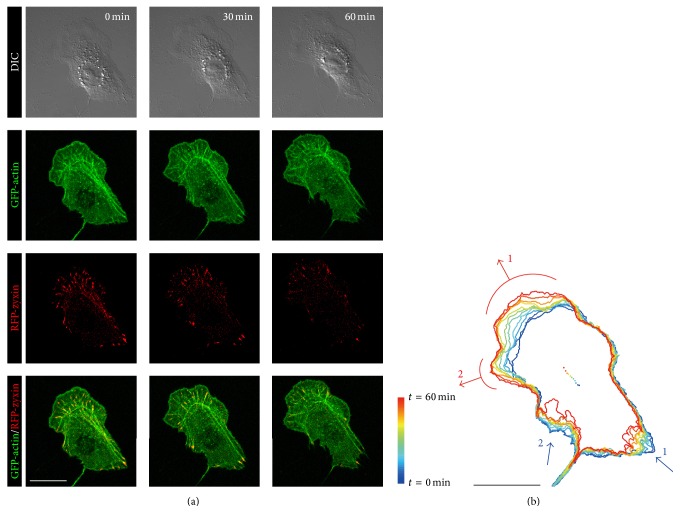
Figure 3.
Protrusion and retraction during migration of a Swiss 3T3 fibroblast. (a) Time-lapse images of DIC, GFP-actin, and RFP-zyxin of cells expressing GFP-actin and RFP-zyxin at t = 0, 30, and 60 minutes. (b) Sequential images of outlines of the cell in (a) are depicted together with the centroid of the cell marked by dots every 6 minutes. The positions of protrusion and retraction are represented by red and blue arrows, respectively. Scale bars: 20 μm.

