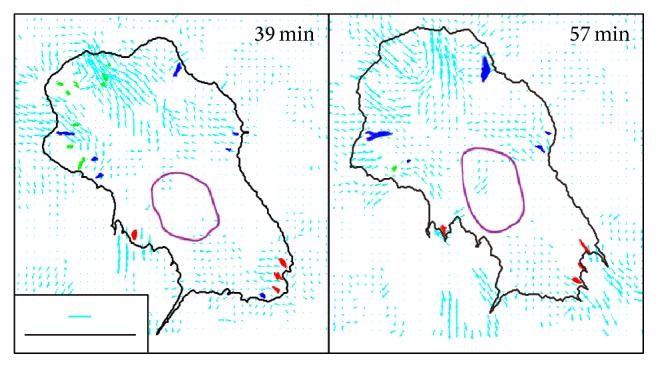
Figure 5.

Displacement field of the substrate. Displacement vectors of the substrate analyzed by image-based template matching are shown by the cyan arrows. The length of the displacement vectors is enlarged from the original size and its scale is shown by the cyan scale bar (3 μm). The positions of the FAs in the front, intermediate lateral, and rear regions are shown in green, blue, and red, respectively. Black scale bar: 20 μm. The analysis here is based on the same data presented in Figures 3 and 4(a)–4(d).
