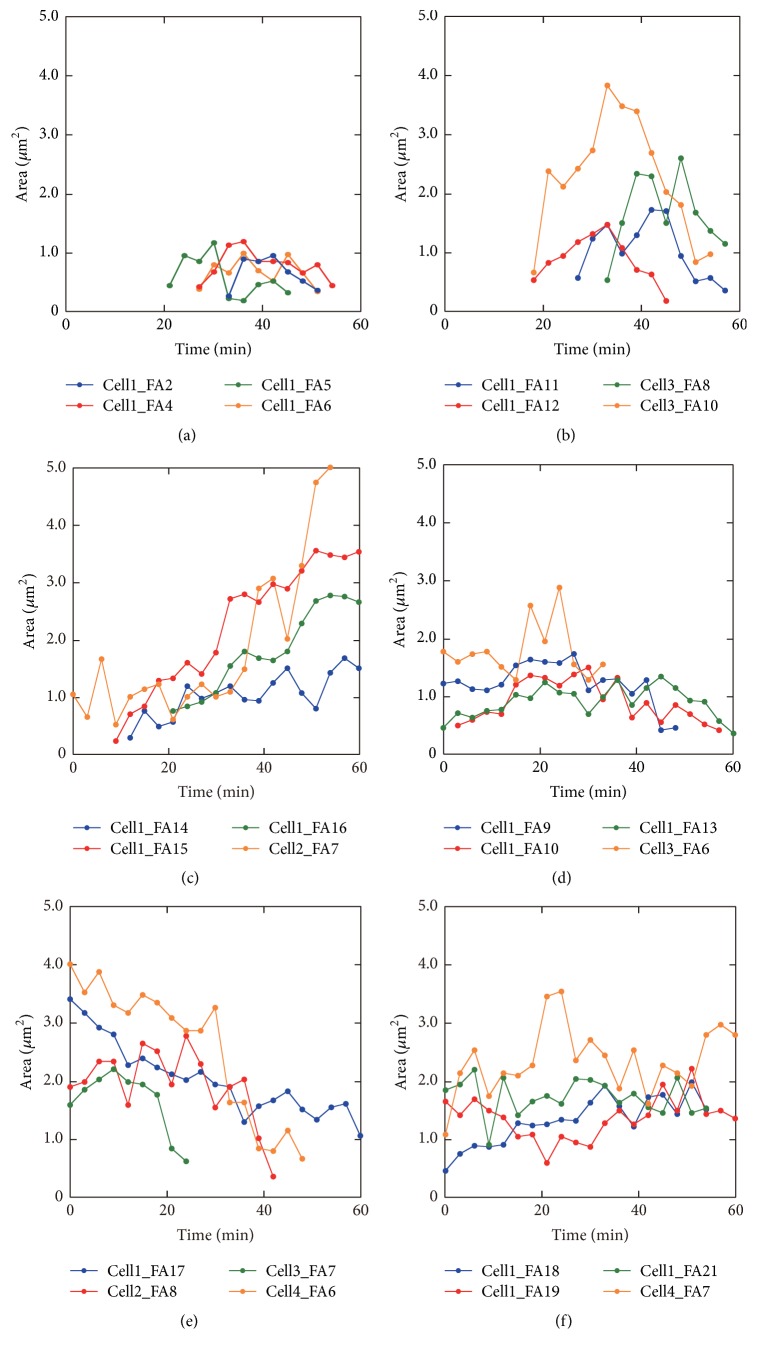
Figure 6.
Growth and decay of FAs in the front, intermediate lateral, and rear regions. Time courses of FA area in the front (a, b), intermediate lateral (c, d), and rear regions (e, f) are shown. Representative 24 FAs from 4 cells, including the cell in Figure 3 (Cell 1) are used for the analysis. FAs were further classified into 2 patterns in each region. The FA number for Cell 1 corresponds to that shown in Figure 4(d).

