Figure 2.
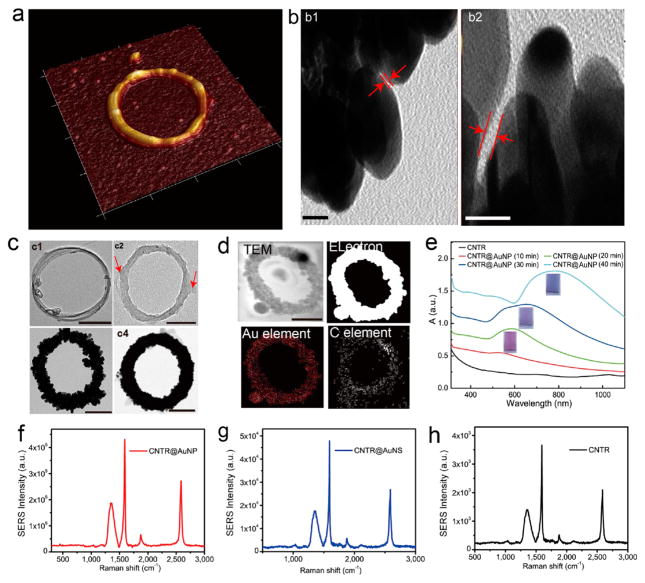
(a) Representative AFM images of CNTR@AuNP. (b) High resolution TEM images of CNTR@AuNP with a gold nanogap among closely attached gold nanoparticles (scale bar: 5 nm). (c) CNTR (c1), CNTR@PvPH (c2) (Arrow: PvPH layer coated on the CNTR surface), CNTR@AuNP (c3), and CNTR@AuNS (c4) obtained at different time points of reducing Au3+. (d) TEM image and elemental mapping of CNTR@AuNP. (e) UV–vis–NIR absorption spectra of CNTR and CNTR@AuNP coated with different densities of AuNP nanoshell. Scale bar, 40 nm. SERS spectra of CNTR@AuNP (f), CNTR@AuNS (g), and CNTR (h) illuminated with a 808 nm laser, respectively.

