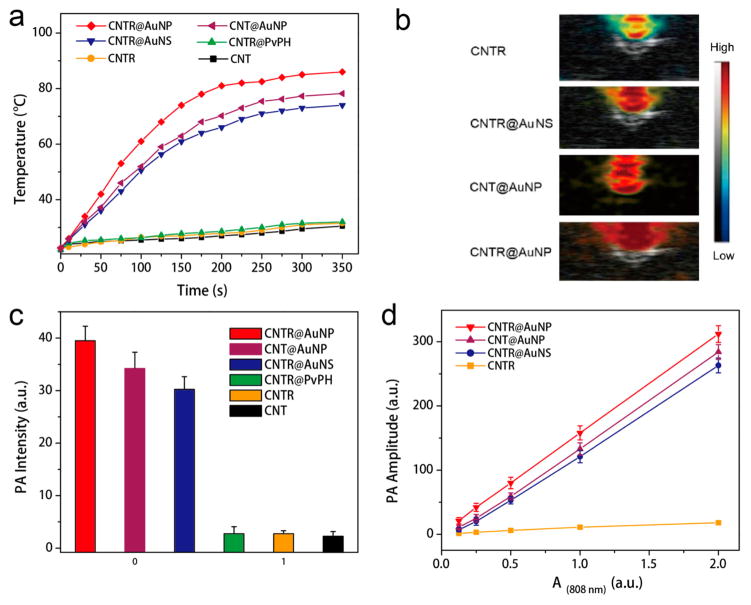
Figure 3.
(a) Temperature variation of CNTR@AuNP, CNT@AuNP, CNT@AuNS, CNTR@PvPH, CNTR, and CNT as a function of laser irradiation time at 0.5 W/cm2. (b) Overlaid ultrasound and PA images of the CNTR@AuNP, CNT@AuNP, CNTR@AuNS, and CNTR illuminated with a 808 nm laser. (c) PA intensity of CNTR@AuNP, CNT@AuNP, CNTR@AuNS, CNTR@PvPH, CNTR, and CNT at the same optical intensity illuminated with a 808 nm laser. (d) PA amplitude of CNTR, CNTR@AuNP, CNT@AuNP, and CNTR@AuNS with increasing optical density at 808 nm.

