Figure 3.
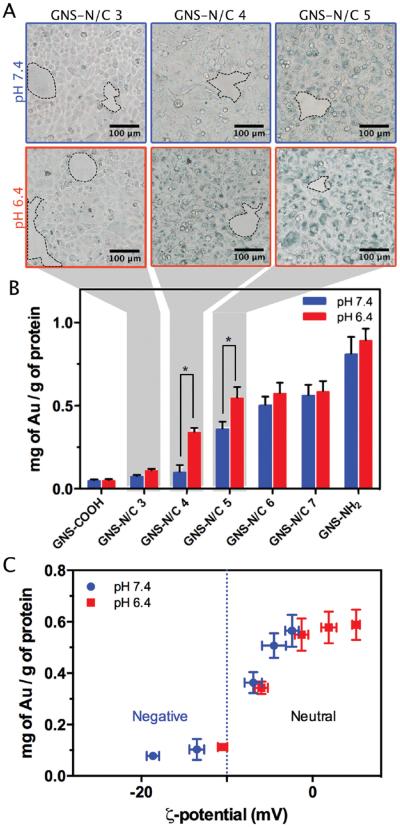
A) Optical microscopy images of HeLa cells after incubation with 80 × 10−12 m GNS-N/C 3–5 for 4 h. Scale bar: 100 μm. The clean background circled in dashed lines indicates the excellent biostability of PEGylated mixed-charge GNSs. B) Cellular uptake of PEGylated GNSs determined by ICP after incubation with 80 × 10−12 m GNS-NH2, GNS-COOH, and GNS-N/C 3–7 for 4 h. Statistical difference has been indicated by asterisks. C) Plot of ICP data quantifying the degree of cellular uptake as a function of the zeta potential of PEGylated mixed-charge GNSs.

