
Figure 3.
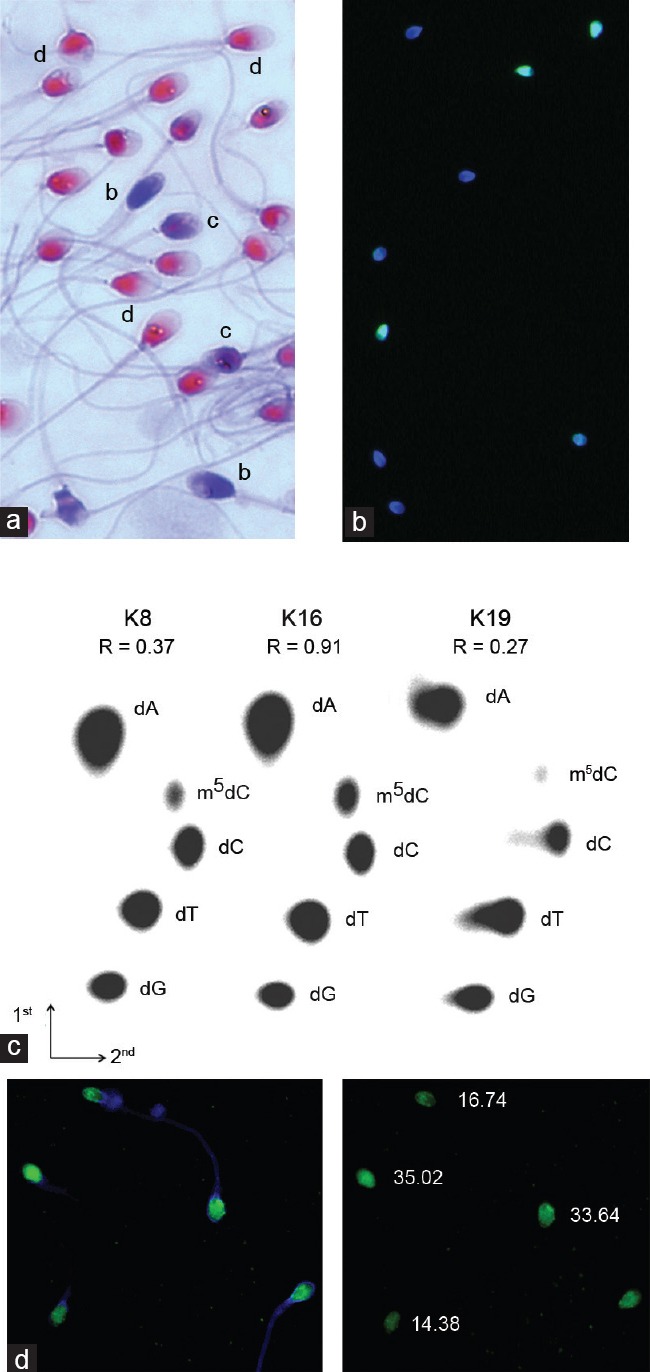
Representative images of the staining results for spermatozoa. The bar represents 5 µm. (a) aniline blue staining of three populations of spermatozoa: b: deprotaminated, c: semi-deprotaminated and d: normal, with a proper protamine: histone ratio; light microscopy, ×1000 magnification; (b) TUNEL assay involving the two populations of spermatozoa: light-green (with fragmented DNA) and blue (only DAPI as a counterstain, without DNA fragmentation); fluorescent microscopy, ×1000 magnification; (c) examples of the two-dimensional thin-layer cellulose chromatography (TLC) analysis of [5’32P]-labeled deoxynucleotides obtained after the enzymatic hydrolysis of DNA. dNp – deoxynucleoside monophosphates: A: adenine; C: cytosine; G: guanine; T: thymine and m5C: 5-methylcytosine. Three different values for the R coefficient are presented; (d) example of the immunofluorescent staining (IF) of spermatozoa. Left panel: merged DAPI and FITC channels; right panel: FITC panel with cell fluorescence (CF) values calculated for five spermatozoa; fluorescent microscopy, ×1000 magnification.